Overview
The Report Viewer is where you access and run all reports on the system. Three types of report are available: Standard, Custom, and System.
To access it, go to Reporting > Reporting Suite > Report Viewer.
Use the three buttons at the top of the page to switch between report types.
Note. In addition to the reports available in the Report Viewer, MaxContact also supports API-based reporting and replicated database access. Contact your account manager or the support team for more information on these options.
Standard reports
Standard reports are available to all customers and are updated and added to on a regular basis. They cover campaign performance, agent activity, inbound demand, compliance, digital channels, and more.
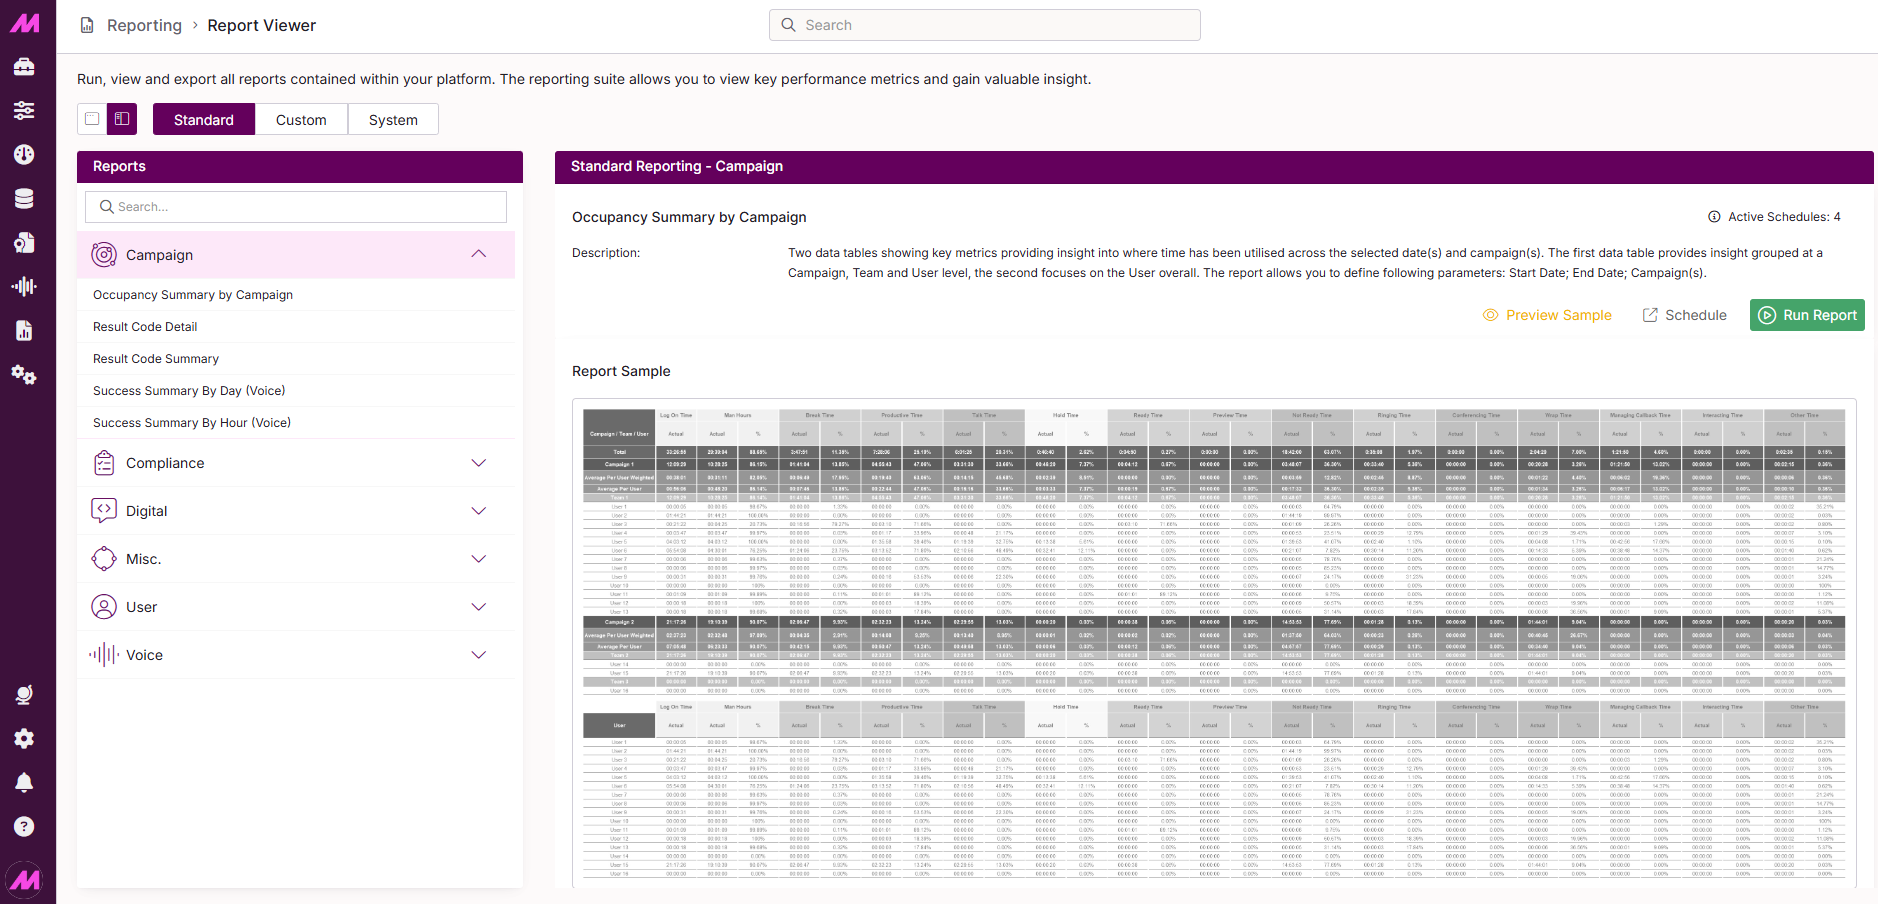
Reports are grouped into six categories in an accordion menu on the left-hand side of the page. Click a category to expand it and see the reports it contains. Hovering over a report name in the accordion displays a run button — clicking it takes you directly to that report.
Selecting a category also loads the list of reports in the main area on the right, where you can access the following options for each report:
| Option | Description |
|---|---|
| Active schedules | Shows how many active schedules are currently set up for this report. |
| Preview sample | Displays an example of the report layout and columns before you run it. |
| Schedule | Takes you to the Report Scheduler to set up an automated delivery schedule for this report. |
| Run report | Opens the report configuration page where you can set the parameters and generate the report. |
Clicking directly on a report name in the list loads its preview sample in the main area of the page.
Report categories
The six standard report categories and the reports within each are listed below.
Campaign Reports
The following reports are grouped under Campaign in the Report Viewer. Each report can be filtered at a campaign level.
| Report | Description |
|---|---|
| Occupancy Summary by Campaign | Provides a breakdown of the time each user has spent within a campaign, including talk, hold, ready, wrap, and break time. |
| Result Code Detail | Provides a per-user breakdown of the result codes used within the campaign. |
| Result Code Summary | Provides a high-level summary of result codes used across the campaign, grouped by lead status and including success, exception, and handle time metrics. |
| Success Summary by Day (Voice) | Provides a per-user breakdown of the number of successes generated, organised by day. |
| Success Summary by Hour | Provides a per-user breakdown of the number of successes generated, organised by hour. |
Compliance Reports
The following reports are grouped under Compliance in the Report Viewer.
| Report | Description |
|---|---|
| Ofcom Drop Rate | Provides a summary view of the Ofcom drop rate and the metrics used in its calculation, filterable by campaign and drop rate target. |
Digital Reports
The following reports are grouped under Digital in the Report Viewer.
| Report | Description |
|---|---|
| Customer Satisfaction by Queue | Provides an overview of the usage and engagement of Customer Satisfaction surveys across digital channels, filtered at a team and queue level. |
| Omni Channel by Interval | Provides a stats overview for digital channels at 15-minute intervals, filtered at an interaction channel level. |
| Omni Channel Daily | Provides a stats overview for digital channels per day, filtered at an interaction channel level. |
Misc Reports
The following reports are grouped under Miscellaneous in the Report Viewer.
| Report | Description |
|---|---|
| Coach Report (Voice) | Provides a view of users who have carried out coaching with other users on voice interactions, including coaching, monitoring, and barging activity. |
| Supplier Summary (Voice) | Provides a detailed view of key performance metrics for data imported from specific suppliers across selected dates. |
User Reports
The following reports are grouped under User in the Report Viewer.
| Report | Description |
|---|---|
| Activity Summary | Provides a view of a user's login and logout activity over a selected period. |
| Break Detail | Provides a detailed view of a user's break activity. |
| Break Summary by Campaign | Provides a high-level summary of break utilisation across campaigns. |
| Break Summary by Day | Provides a daily view of break metrics across campaigns. |
| Customer Satisfaction by User | Provides insights on the usage and engagement of Customer Satisfaction surveys at a per-user level. |
| Data Usage (Voice) | Provides a detailed overview of a user's data usage across calls, including connects, successes, finals, and exceptions. |
| Inbound User Performance (Voice) | Provides a detailed overview of users handling inbound calls, including answered calls, successes, and handle time metrics. |
| Occupancy Summary by User | Provides an overview of the time a user has spent in each system status, including talk, hold, ready, break, and wrap time. |
| Omni Agent Overview | Provides a stats overview of interactions handled by a user across digital channels. |
| Performance (Voice) | Provides a detailed overview of a user's dialling activity and call conversions, including successes, callbacks, and handle time metrics. |
| Status Change Detail | Provides a minute-by-minute breakdown of a user's activity and status changes within the system for a selected date. |
| User Attendance | Provides a stats overview of a user's logged-in times, including first login, last logout, man hours, and break time. |
| Wellbeing Card Analysis | Provides a detailed overview of user engagement with a specific Wellbeing card type. |
| Wellbeing Overview | Provides a high-level view of usage and engagement across all Wellbeing cards. |
Voice Reports
The following reports are grouped under Voice in the Report Viewer.
| Report | Description |
|---|---|
| Abandon Summary (Inbound) | Provides an overview of inbound calls that have been abandoned in a queue, filterable by queue and inbound number. |
| Data Usage Summary (Voice) | Provides insight into how data is being utilised within a campaign, including connects, successes, finals, and exceptions. |
| Demand Summary (Inbound) | Provides a high-level summary of performance metrics for inbound calls per hourly interval. |
| IVR Overview | Provides a breakdown of the IVR elements inbound calls have entered across a set date range, including hit counts, answered calls, abandoned calls, and duration metrics per element. |
| Inbound Result Code by Interval | Provides a high-level summary of the result code breakdown for inbound calls, shown at 15-minute intervals. |
| Inbound Summary | Provides a high-level summary of performance metrics for inbound calls, including offered, answered, abandoned, SLA, and handle time data by queue. |
| Intraday (Inbound) | Provides a high-level summary of inbound call performance metrics broken down by hour and 15-minute intervals. |
| List Performance | Provides a high-level summary of key metrics giving insight into performance across a campaign, including connects, successes, drops, and answer machine data. |
| List Performance by Day | Provides a detailed view of performance metrics for lists on a day-by-day basis, including records loaded, contacts, successes, and conversion rates. |
| Performance Summary (Voice) | Provides insight into outbound campaign performance across a set date range, including calls, persons, DMCs, successes, and productive time. |
| Performance Summary by Hour (Voice) | Provides a high-level summary of campaign successes and associated metrics broken down by hour. |
| Performance Summary by Week (Voice) | Provides a detailed view of a specific campaign's successes and associated metrics broken down by week. |
| Queue Occupancy | Provides a breakdown of how agent time has been utilised across a selected queue, covering productive, non-productive, and break time in detail. |
Custom reports
Custom reports are reports you have built yourself within the product using the Custom Report Builder. This view will be blank on a new system with no custom reports created yet. Custom reports built by the MaxContact support team on your behalf also appear here.
The following options are available for each custom report:
| Option | Description |
|---|---|
| Active schedules | Shows how many active schedules are currently set up for this report. |
| Report builder | Takes you to the Custom Report Builder to view or edit the report configuration. |
| Schedule | Takes you to the Report Scheduler to set up an automated delivery schedule for this report. |
| Run report | Opens the report configuration page where you can set the parameters and generate the report. |
System reports
System reports are built by MaxContact to specific requirements that cannot be met through standard or custom reports. They are requested through the support team or your account manager and are unique to each customer. This view will be blank if no system reports have been built for your organisation.
The following options are available for each system report:
| Option | Description |
|---|---|
| Active schedules | Shows how many active schedules are currently set up for this report. |
| Schedule | Takes you to the Report Scheduler to set up an automated delivery schedule for this report. |
| Run report | Opens the report configuration page where you can set the parameters and generate the report. |