Overview
The Live Queues page gives you a real-time view of all your inbound queues. You can monitor agent availability and queue activity, and make changes on the fly — including moving agents between queues without leaving the page.
To access it, go to Management > Live Queues.
Example use case: You notice demand is higher than usual on one queue. You temporarily add agents from another queue to help cover it. Because the move is set as temporary, those agents automatically revert to their original queues at midnight — no manual reset needed.
Page controls
Use the controls along the top of the page to filter and adjust what's displayed.
| Control | Description |
|---|---|
| Type | Filters the page by interaction type: All, Call, Email, or Chat. |
| User | When toggled on, filters the queue display to show only the queues relevant to the agent selected in the Available Users panel. |
| Offline users | Toggles offline users on or off in the Available Users panel. |
| Channel | Filters queues by channel. |
| Order users by | Sorts the user list by: Username, Time in Status, Longest Interaction, or Queue Capacity. |
Grid view icon | Switches the queue display between the default queue information view and the grid view. |
Panel icon | Opens the right-hand detail panel. |

Available users
The Available Users panel lists agents currently logged in. Each agent's name is colour-coded to show their current status:
| Colour | Status |
|---|---|
| Blue | Ready |
| Red | Not Ready |
| Black | Logged Off |
| Green | Talking/Interacting |
| Yellow | Dispositioning |
| Purple | On Break |
The time shown next to each agent is their time in current status. The bracketed figure shows their total interaction capacity and how many they currently have open.
When Offline Users is toggled off, only logged-in agents are shown. Toggle it on to see all users on the system, including those who are offline.

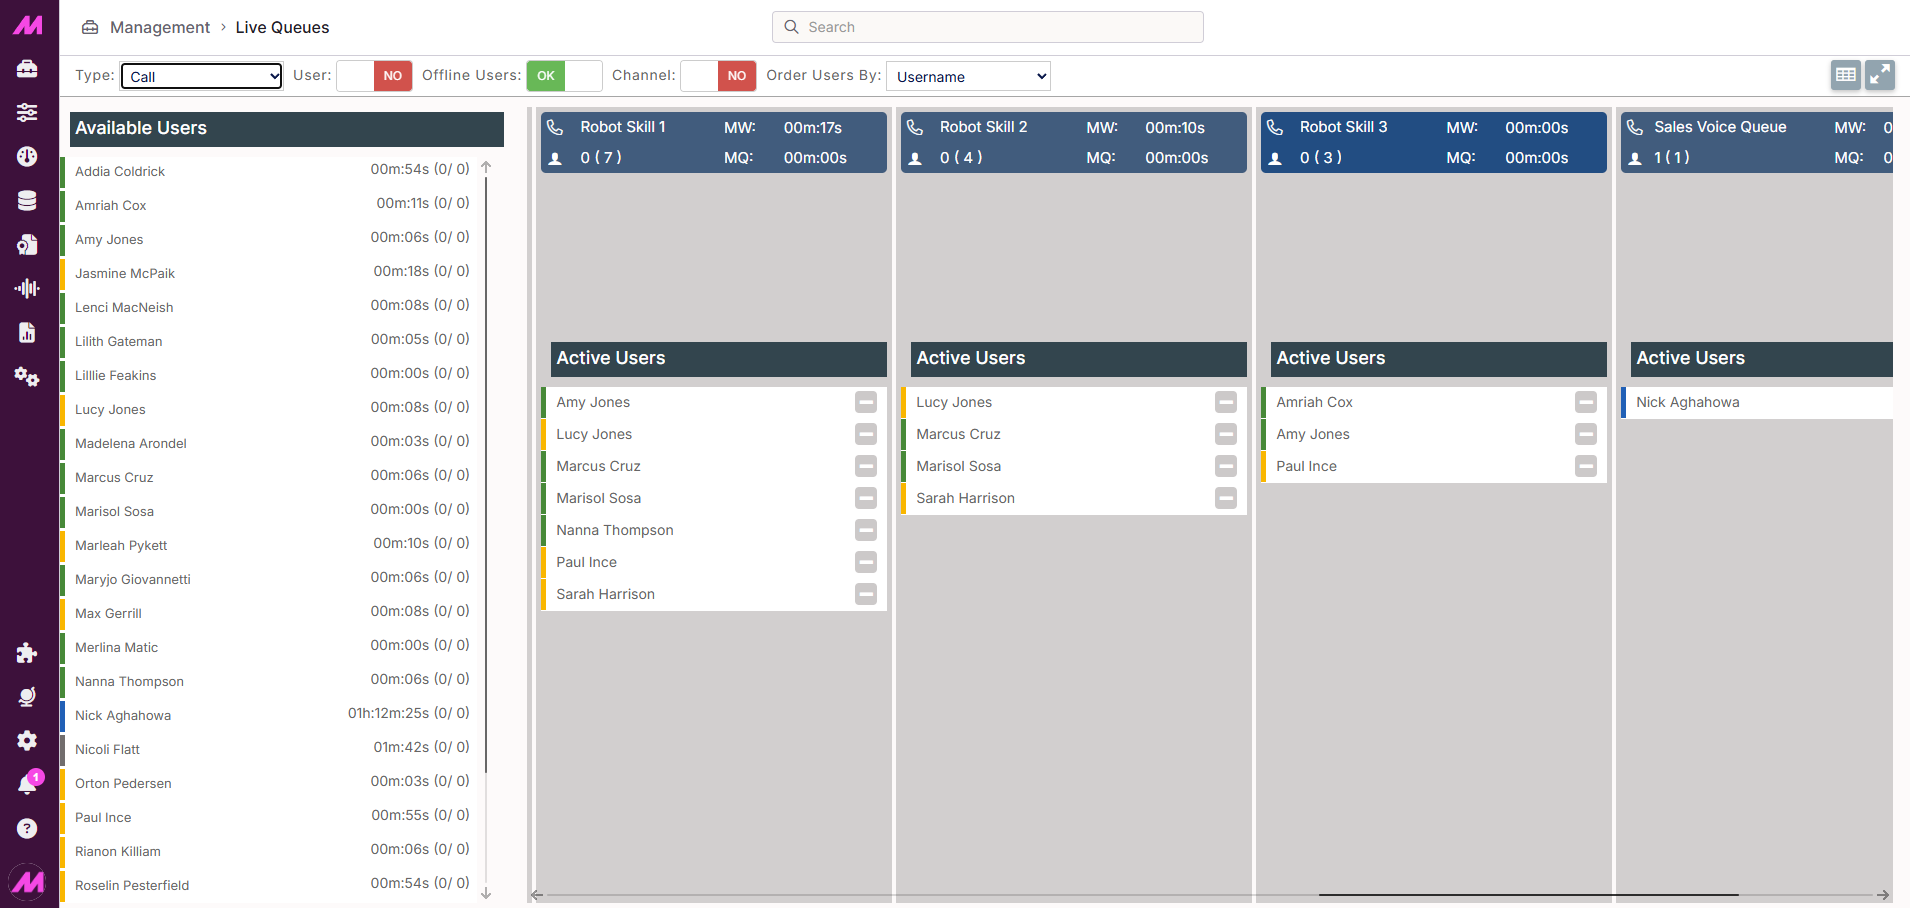
Queues display
The main area of the page shows all queues configured on your system. By default these display in the queue information view. Use the view toggle button to switch to the grid view.
Queue information view
Each queue card shows the following at a glance:
| Field | Description |
|---|---|
| Channel icon | Denotes the queue type: call, webchat, email, SMS, or conversational. |
| MW | Maximum Wait time — the longest a contact has been waiting in this queue. |
| MQ | Maximum Queue time — the maximum queue time configured for this queue. |
| Agent icon | Shows the number of agents currently waiting (ready) in the queue. The bracketed number is the total agents allocated to it. |
Active users
Below the queue header, you can see all agents active in that queue. Colour coding matches the status indicators in the Available Users panel, and the time shown reflects how long the agent has been in their current status.
If Force Ready is disabled for the channel, a green icon appears next to agents who are not ready — clicking it puts them back into the ready state immediately.
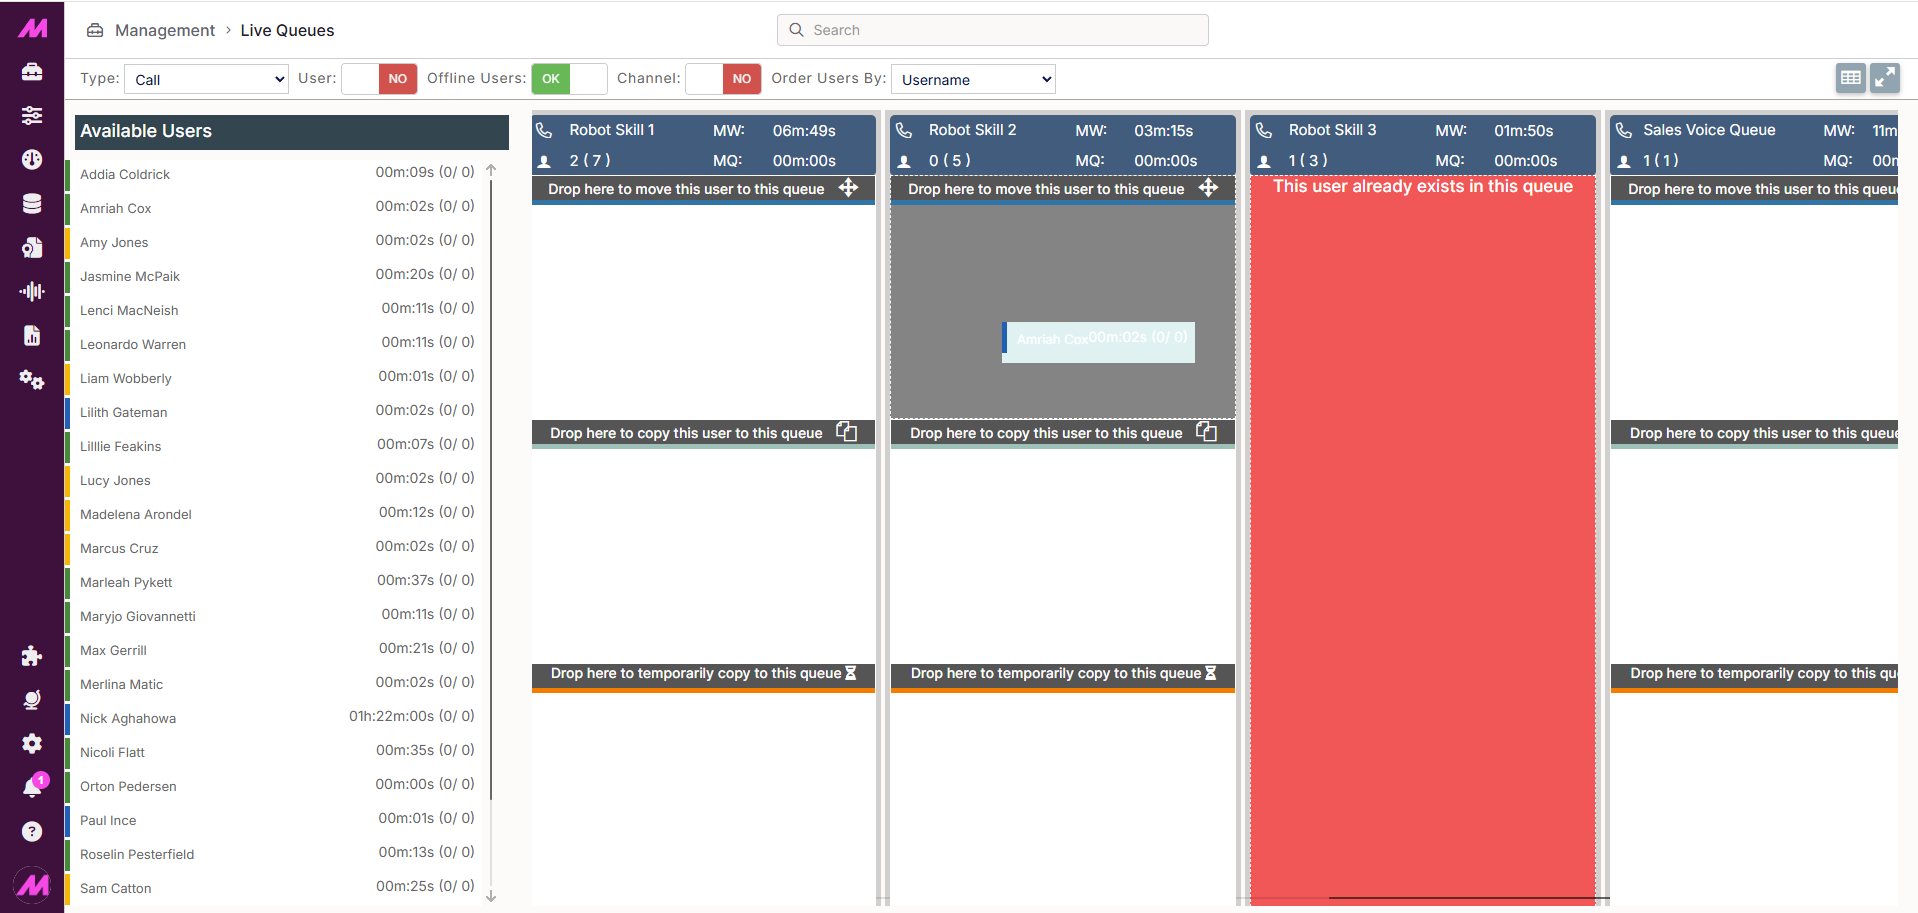
Moving agents between queues
Drag an agent from one queue and drop them onto another to move them. When you start dragging, three drop zones appear on each target queue:
| Drop zone | Effect |
|---|---|
| Move to this queue | Removes the agent from their current queue and adds them to the new one permanently. |
| Copy to this queue | Keeps the agent in their original queue and adds them to the new one permanently. |
| Temporarily copy to this queue | Keeps the agent in their original queue and adds them to the new one until midnight. |
Note: If a move isn't permitted — for example, the agent is already in the target queue, or you're moving them from an interaction queue to a call queue — the screen highlights the restriction in red.

Grid information view
The grid view shows a live summary of all your queues in a single table.
| Column | Description |
|---|---|
| Queue name | The name of the queue. |
| Channel name | The channel associated with the queue. |
| Type | The interaction type. |
| ID | The queue's system ID, automatically assigned on creation. |
| Received | Total interactions received. |
| Capacity | Total queue capacity — the sum of each active agent's individual capacity. |
| Assigned | Number of interactions currently assigned to an agent. |
| Timed out | Total interactions that reached the queue's maximum timeout. |
| Approaching SLA | Interactions currently approaching the SLA threshold set on the channel. |
| Over SLA rate | Total interactions that have exceeded the SLA set on the channel. |
| Abandon rate | Percentage of interactions abandoned (abandons ÷ total interactions × 100). |
| Route fails | Total interactions that failed to route successfully. |
| Route fail rate | Percentage of interactions that failed to route. |
| Staffed | Number of agents active on the queue. |
| Waiting | Number of agents in the ready state. |
| In queue | Number of interactions currently waiting in the queue. |
| Per minute | Interactions handled per minute. |
| Max queue time | The longest current wait time across live interactions in the queue. |
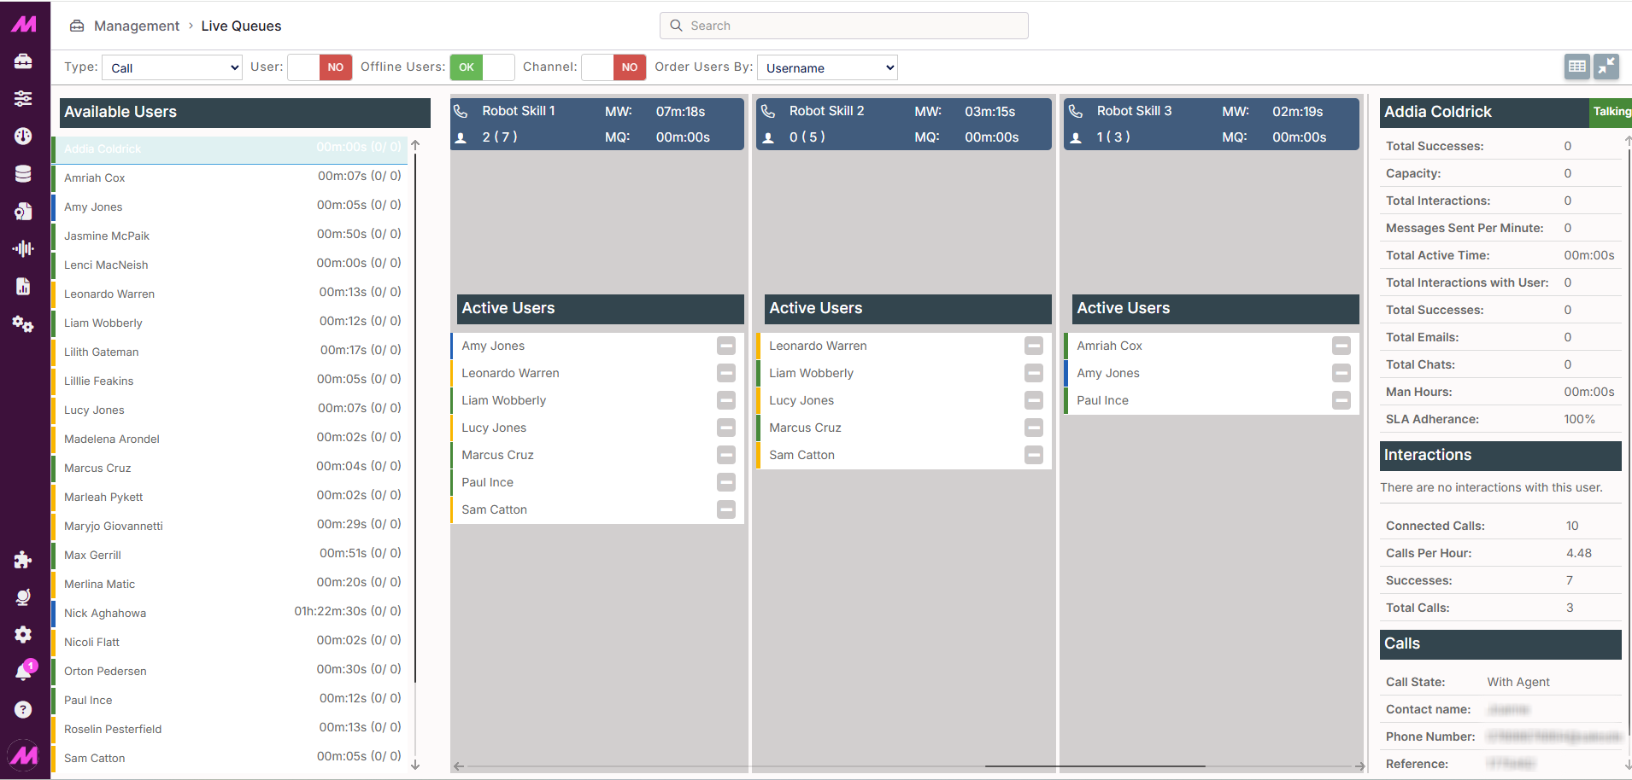
Right-hand panel
Selecting an agent from the Available Users panel opens their detail view in the right-hand panel. This shows:
- Overall stats for the day
- A panel for each interaction they currently have open
- Call stats for the current day
Selecting a queue from the grid view opens the queue's detail panel, showing stats for that queue for the current day.