
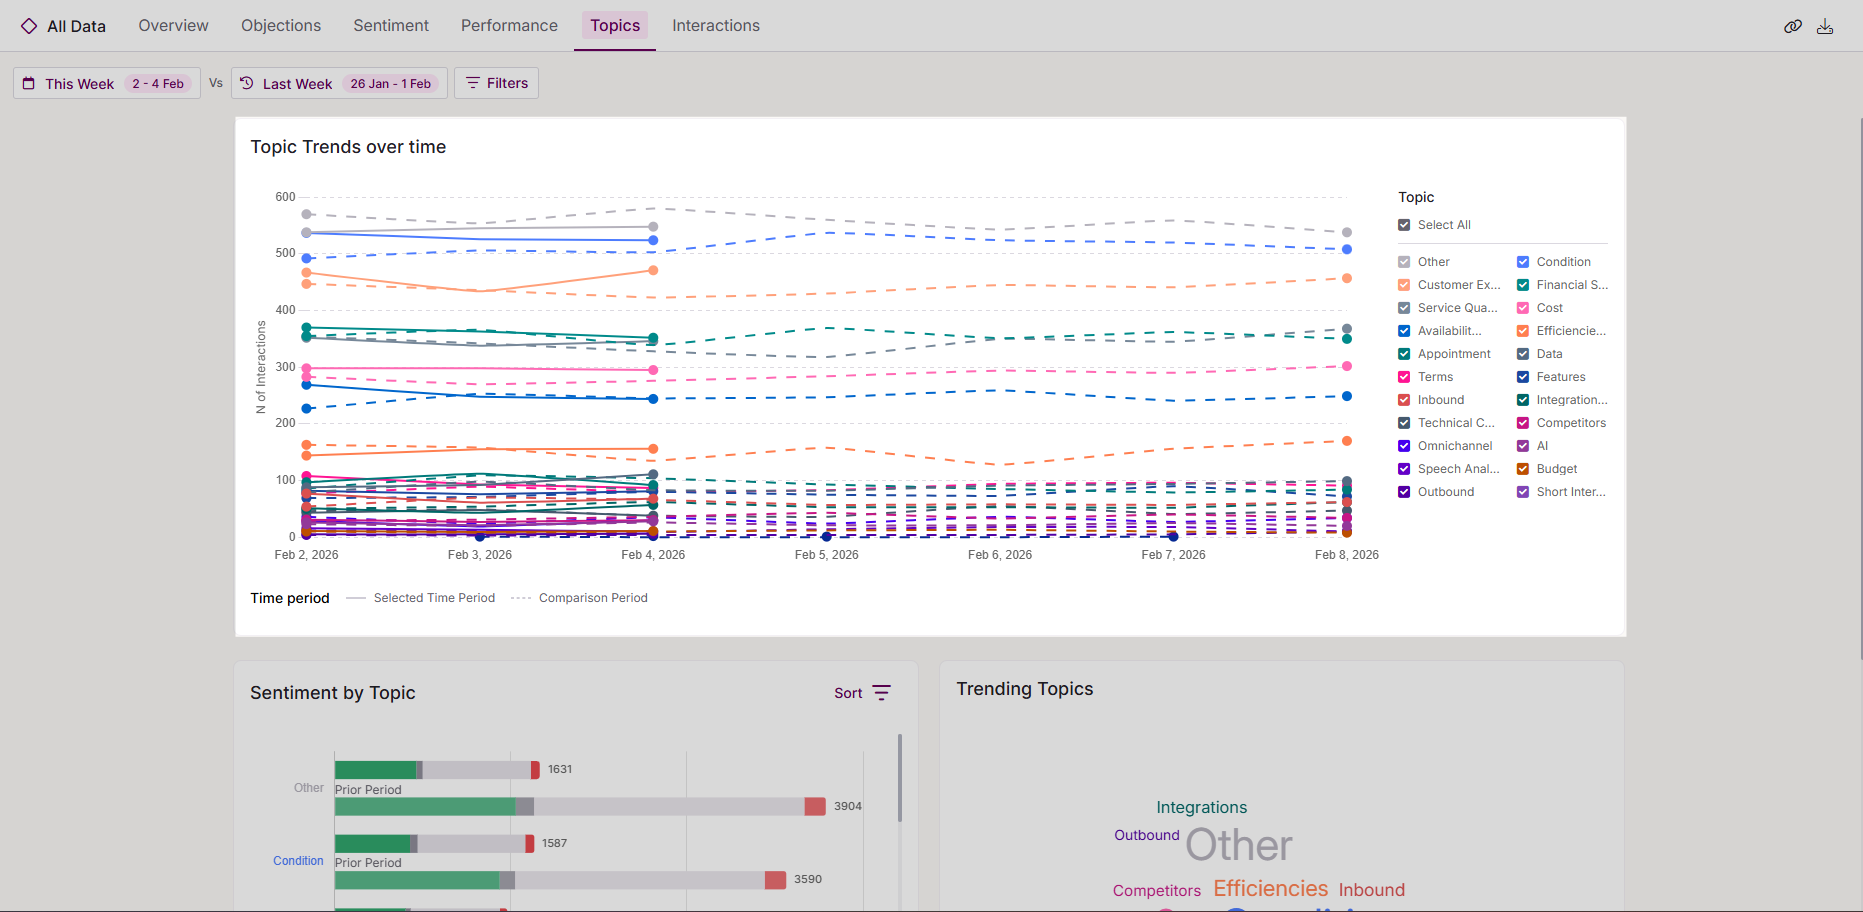
Topics Trends over time
Within the selected date range, the line chart shows the number of interactions across each topic type.
You can narrow the view to specific topics by selecting or deselecting them in the right-hand menu.
Solid lines represent data for the selected period, while dashed lines show the comparison period.
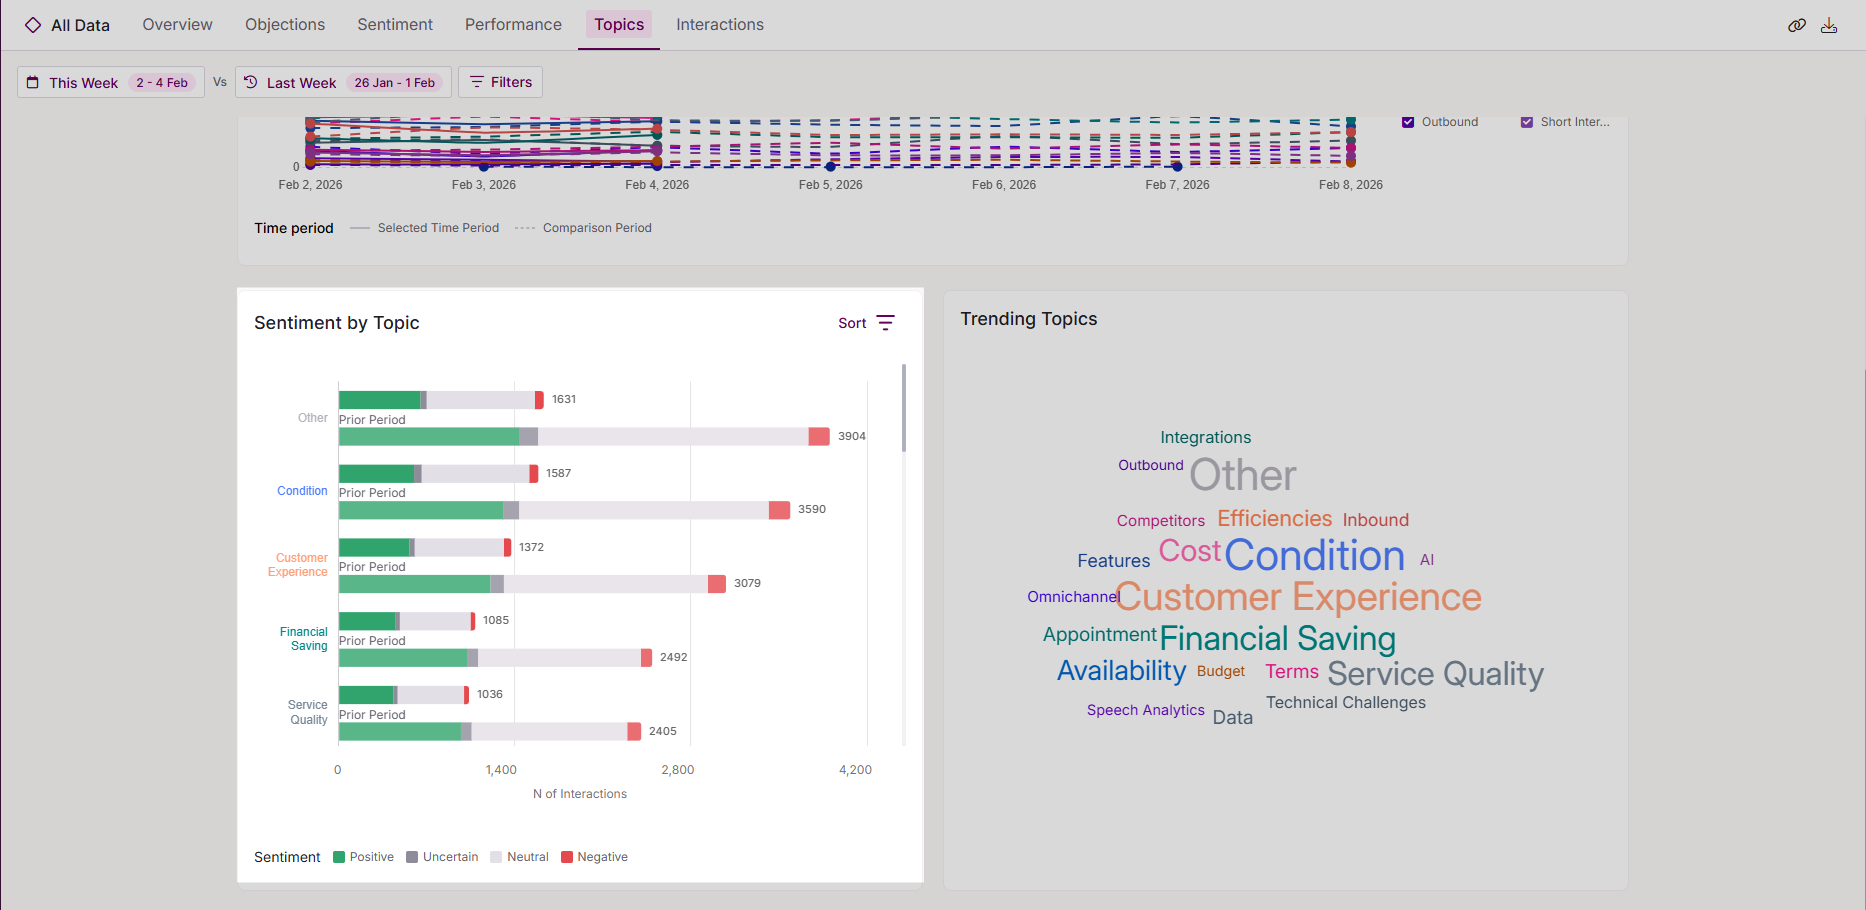
Sentiment by Topic
Analyse sentiment by topic to see whether specific topics lean more positive or negative. To learn more about Sentiment, check out this article.
Trending Topics
The trending topics pane will display up to 21 topics that the analytics engine has identified from the calls it has analysed, within the selected time period. Note that for the sake of clarity, we do not include data on the comparative time period of this data.
| Hovering over a topic will give you more information on how many times the topic was identified in conversation. You will also see the percentage of the conversations in which the topic was mentioned. | 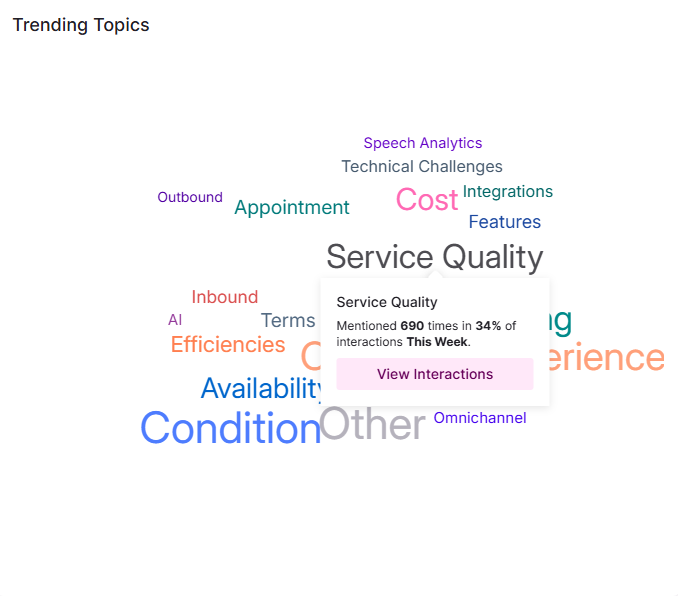 |
| Tip! Topics are adjustable, so if you identify emerging topics or wish to adjust these, contact our team to have these amended. | |
| Should you wish to look at the conversations involved with a topic, you can click on the topic word, which will then give you the pop-up. Clicking the 'view interactions' button will take you to the interactions page in order to view and listen to the conversations. |