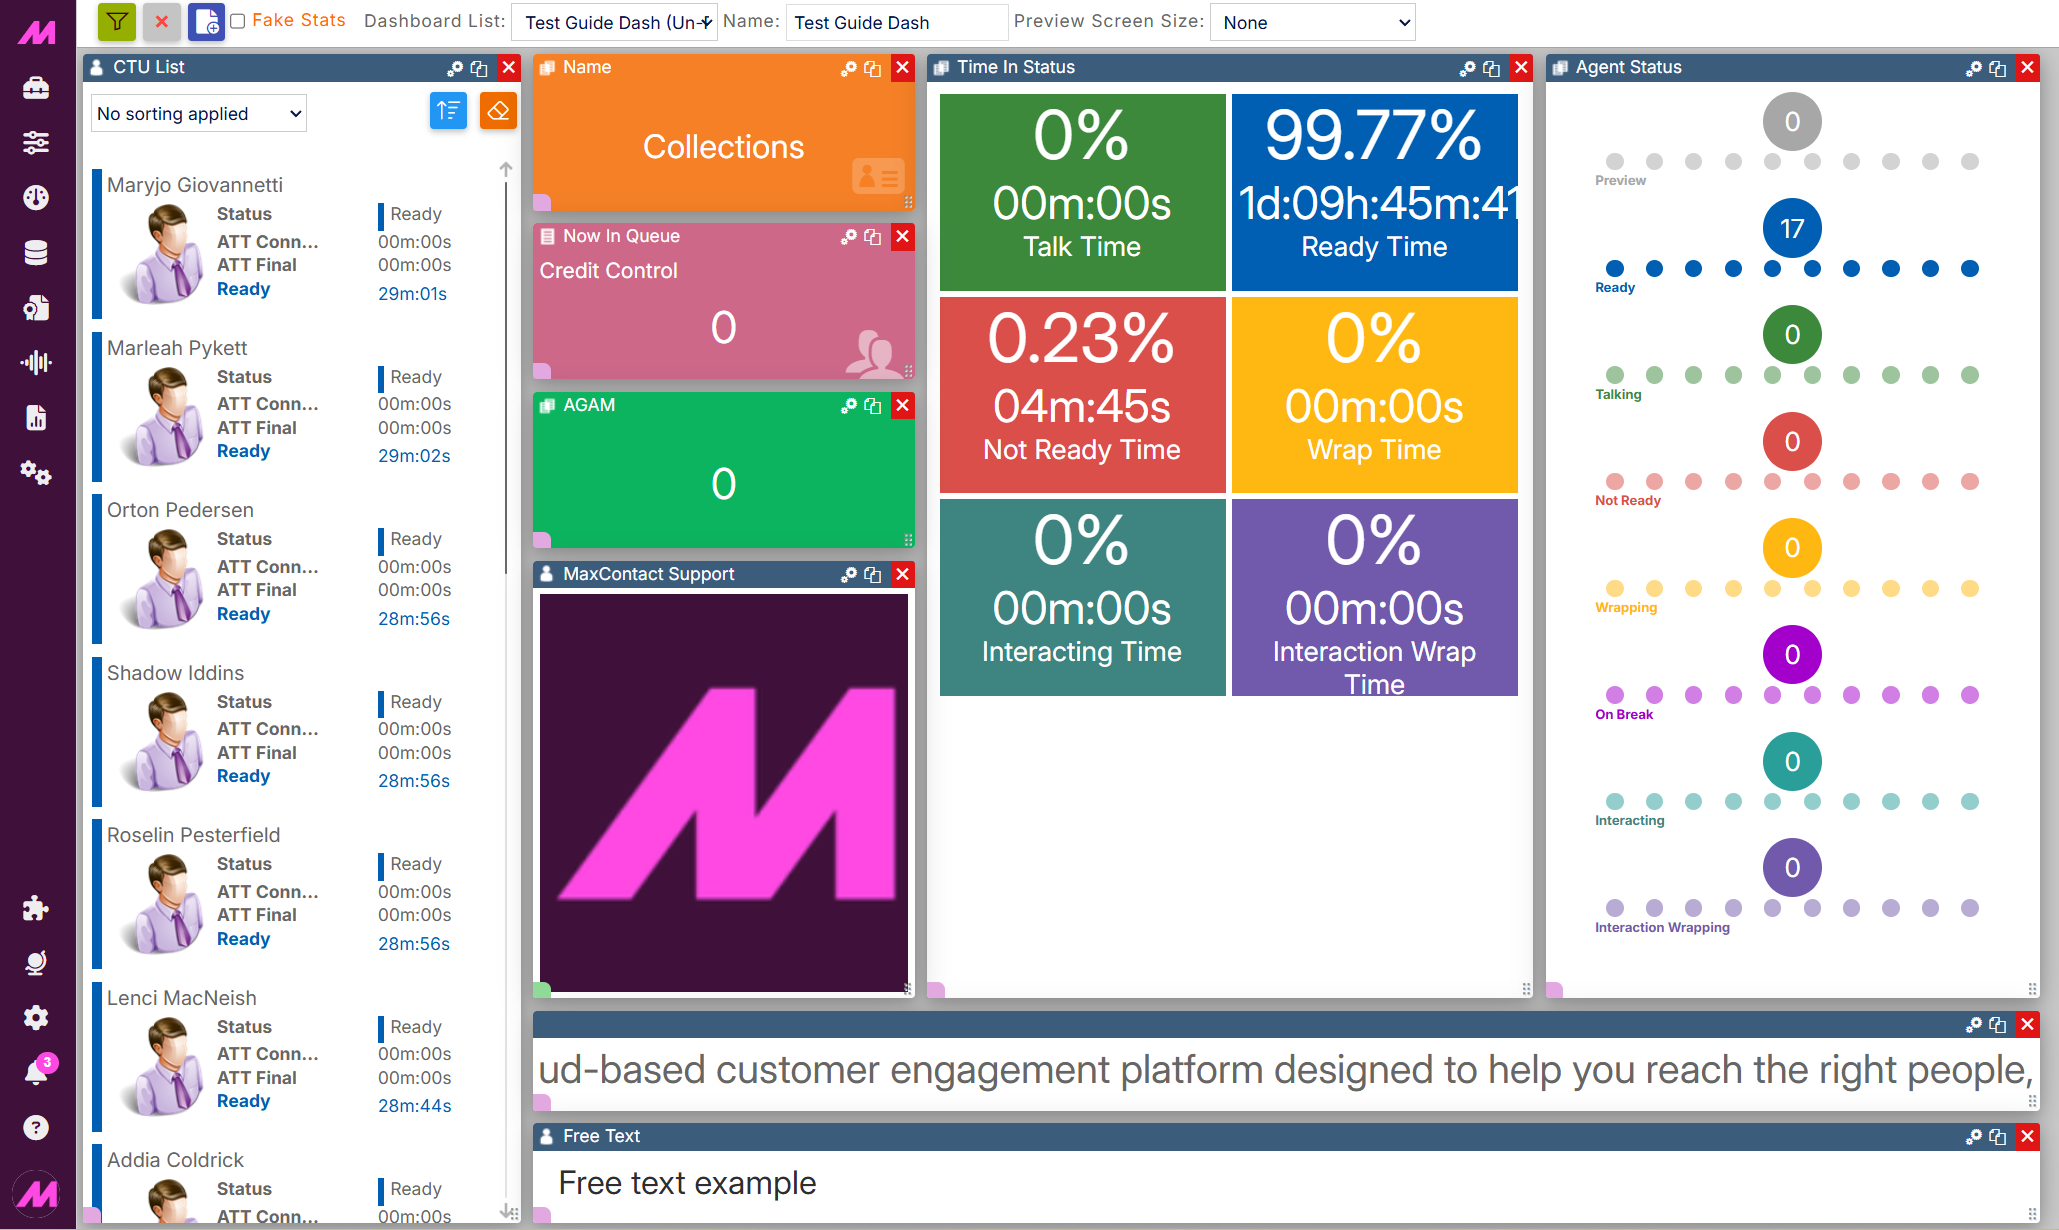
Dashboard Widgets - Live Tiles
Live Tile widgets display real-time statistics on your dashboards and wallboards. This article covers each Live Tile type and the settings available within them.
Available Live Tiles
| Widget | Description |
|---|---|
| CTU List Tile | Displays a list of Campaigns, Lists, Teams, or Users alongside up to three configurable stats per entry. Includes quick actions for managing the selected entity. |
| Stats Tile | Displays a single statistic for a selected Campaign, List, Team, or User. The widget size and font size can be adjusted. |
| Queues Tile | Displays information about inbound queues, including offered/answered calls and threshold alerts. |
| Result Code Tile | Shows how many times a selected result code has been used today. |
| Free Text | A free-form text widget where you can write and style your own content directly on the dashboard. |
| Picture | Displays images associated with Campaigns, Lists, Teams, or Users. Images are set on the CTU page and cannot be changed from within the widget. |
| Time in Status | Shows Talk Time, Ready Time, Not Ready Time, and Wrap Time for a selected Campaign, List, Team, or User. |
| Agent Status | A quick-glance view of what agents are doing at any one time, showing Preview, Ready, Talking, Not Ready, Wrapping, Intereacting, and On Break states. Font size can be adjusted in settings. |
| Ticker | Displays a scrolling message from a configured Banner. The message can be updated via the Banners page without needing to modify the dashboard. |
 Data Type: List Data Type: List |
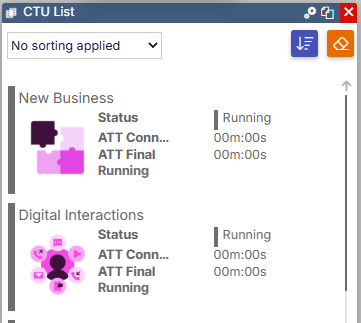
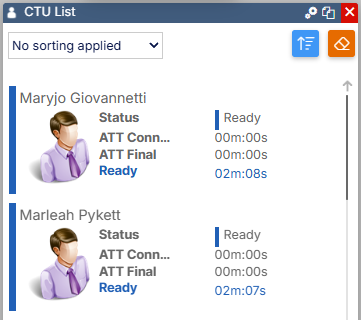
CTU List Tile
The CTU List Tile displays a list of Campaigns, Lists, Teams, or Users with up to three configurable stats per entry. Select the settings icon on the tile to configure it.
| Setting | Description |
|---|---|
| Data Type | Select between Campaign, List, Team, and User. The available stats and quick actions change depending on the data type selected. |
| Hide Stats (Compact Mode) | Hides the stats columns from the widget, showing only the entity names in a more compact layout. |
| Primary, Secondary and Tertiary Stats | Select up to three stats to display for each entry. The available stats vary depending on the selected Data Type. |
Quick actions
When agents are displayed, the following quick actions are available on each row.
| Data Type | Available quick actions |
|---|---|
| User | Edit the user via the CTU page, Kick (log off) the user, open the Coaching page, view the agent's stats in a dialog box, and add a note against the user. |
| Team | Edit the team via the CTU page and view the team's stats in a dialog box. |
| List | Edit the list via the CTU page and view the list's stats in a dialog box. |
| Campaign | Edit the campaign via the CTU page, pause the campaign, and view the campaign's stats in a dialog box. |
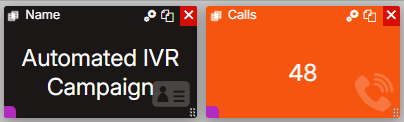
Stats Tile
The Stats Tile displays a single statistic for a selected entity. Select the settings icon to configure it.
| Setting | Description |
|---|---|
| Data Type | Select the data type to display — Campaign, List, Team, or User. |
| Data to display | The specific statistic to show on the widget. |
| Font size | Sets the size of the stat displayed on the widget. |
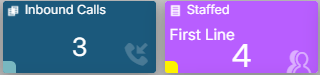
Queues Tile
The Queues Tile displays statistics for a selected inbound queue. Select the settings icon to configure it.
| Setting | Description |
|---|---|
| Data to display | The statistic to display on the widget. |
| ACD Queue | The inbound queue to display the statistic from. |
| Show Queue Name | Displays the queue name on the widget. |
| Name Font Size (px) | Sets the font size of the queue name displayed on the widget. |
| Font size (px) | Sets the font size of the stat displayed on the widget. |
| Stat alert | Enable to configure a threshold alert on the stat. When triggered, the widget flashes on the dashboard and plays the selected audio file. See the alert settings below. |
Alert settings
| Setting | Description |
|---|---|
| Threshold | The value at which the alert is triggered. |
| Alert on every change | When enabled, the alert fires each time the stat changes while it is at or above the threshold, rather than only when it first reaches it. |
| Audio file | The audio played when the alert triggers. Audio files must be no longer than 2 seconds and in .wav format. |
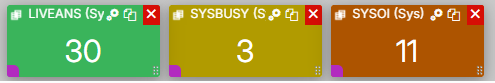
Result Code Tile
The Result Code Tile shows how many times a selected result code has been used today. Select the settings icon to configure it.
| Setting | Description |
|---|---|
| Data Type | Select the data type to display — Campaign, List, Team, or User. |
| Select a Result Code | The result code whose usage count will be displayed. |
| Font size (px) | Sets the size of the count displayed on the widget. |
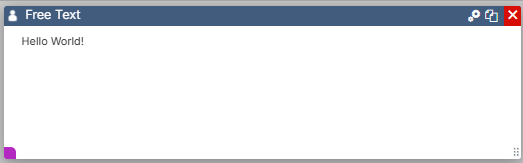
Free Text
The Free Text widget lets you write and style your own content directly on the dashboard. Select the settings icon to open the text editor, where you can format text and adjust the layout using the available options.
Picture
The Picture widget displays images associated with Campaigns, Lists, Teams, or Users on the dashboard.
| Setting | Description |
|---|---|
| Data Type | Select which data to display — Campaign, List, Team, or User. |
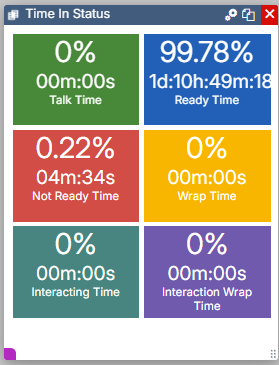
Time in Status
The Time in Status widget shows four statistics: Talk Time, Ready Time, Not Ready Time, Interacting Time, and Wrap Time. It can be configured to display data from Campaigns, Lists, Teams, or Users.
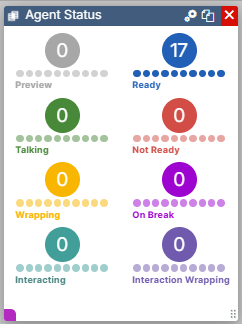
Agent Status
The Agent Status widget provides a quick-glance view of what agents are doing at any one time. It displays the following states: Preview, Ready, Talking, Not Ready, Interacting, Wrapping, and On Break. The widget can be resized on the dashboard and the font size can be adjusted in the settings.

Ticker (a.k.a Banner)
The Ticker widget displays a scrolling message from a configured Banner. The message can be updated via the Banners page at any time — changes take effect immediately without needing to modify the dashboard. Select the settings icon to configure the widget.
| Setting | Description |
|---|---|
| Select a ticker | A dropdown of all the Banners configured on the system. |
| Scroll Speed | Sets the speed at which the text scrolls across the widget. |
| Widget Title | A title displayed in the widget's status bar above the scrolling text. |
| Font size (px) | Sets the size of the scrolling text. Note that the font size does not change when the widget is resized on the dashboard. |