Dashboard Widgets — BI
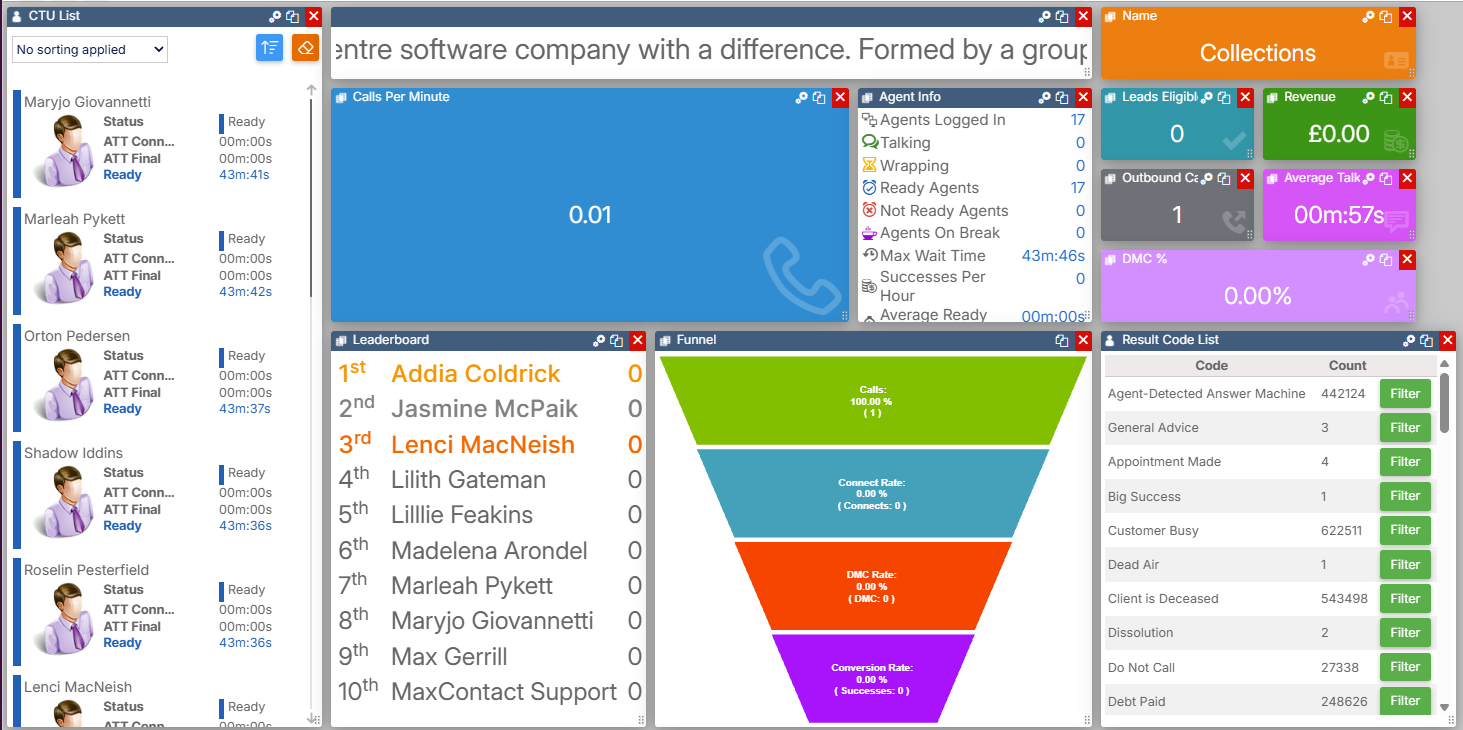
BI widgets display historical information pulled from the database, rather than the live or real-time data shown by other widget types. All BI widgets are found in the BI section of the widget toolbox.
| Widget | Description |
|---|---|
| Date Filter | Controls the date range that other BI widgets on the same page filter by. |
| Result Code List | Shows result code data in a list, with the ability to apply filters to other widgets on the page. |
| Result Code Chart | Shows a pie chart breakdown of result codes, filterable by Campaign, List, Team, User, and date range. |
| Report Grid | Displays the results of a System Report in a grid. |
| Report List | Displays the results of a System Report as label and value pairs rather than a grid. |
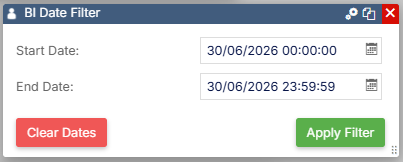
Date Filter
The Date Filter widget changes the date range that BI widgets on the current page filter by. For example, if a Result Code Chart widget is on the same page, its result code history will be limited to the selected date range.
Select the date or time shown on the widget to open a date and time picker. Select the settings icon to configure the widget's preset range options.
| Setting | Description |
|---|---|
| Date range | Select from the available preset ranges: Today, Yesterday, This Week, Last Week, Last 2 Weeks, This Month, Last Month, Last 3 Months, This Quarter, or Last Quarter. |
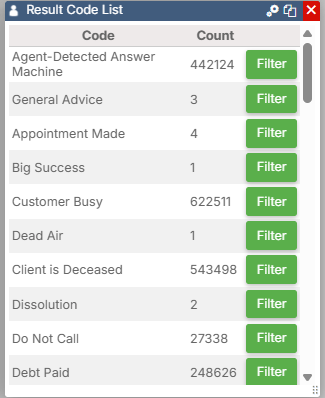
Result Code List
The Result Code List widget shows the same information as the Result Code Chart widget below, using the same filter parameters. Selecting the Filter button on a row applies an additional filter to any other widgets on the page that listen for it. For example, if a Report Grid on the same page uses result code data to filter, the grid will update when the filter is applied.
| Setting | Description |
|---|---|
| Filter by Result Code | Choose between User result codes and System result codes. Type the result code or codes you want to filter by, or select them from the list below. |
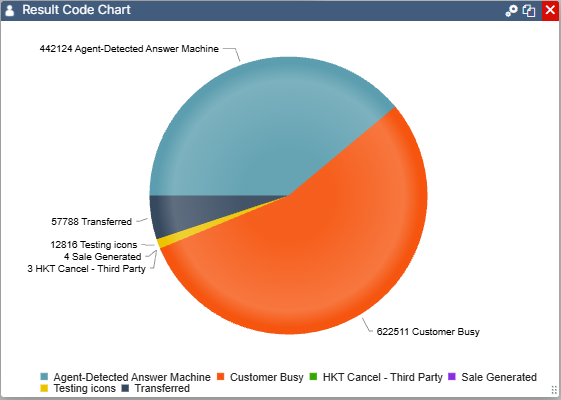
Result Code Chart
The Result Code Chart widget displays a pie chart breakdown of all result codes, filterable by Campaign, List, Team, User, and date range (start and end).
Chart settings
| Setting | Description |
|---|---|
| Show Legend | Select whether to show the legend on the chart. |
| Legend Position | Choose where the legend is displayed. |
| Show Labels | Shows or hides the labels around the pie chart. |
| Show 'Other' Codes | Groups any hidden result codes together into a single "Other" figure on the chart. |
| Filter by Result Code | Choose between User result codes and System result codes. Type the result code or codes you want to filter by, or select them from the list below. |
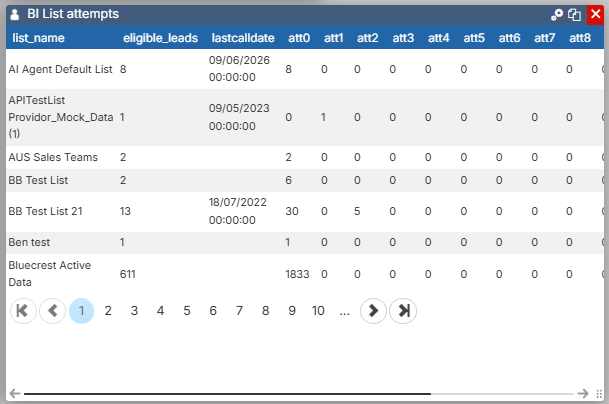
Report Grid
The Report Grid widget displays the results of a System Report in a grid. Select the settings icon to choose which report is displayed in the widget.
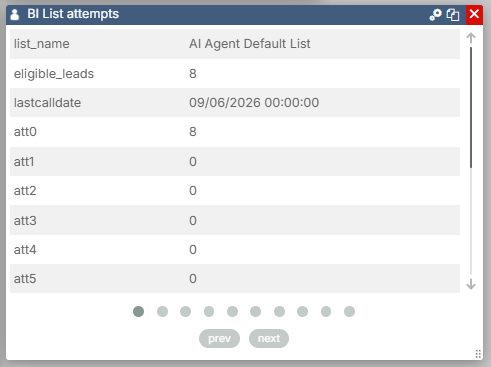
Report List
The Report List widget is similar to the Report Grid widget but displays the data as label and value pairs rather than in a grid. This is useful for reports that return a small number of calculated figures — for example, Active Records, Dialled Records, and Total Attempts from a selected list. If a report returns more than one row, a pager is included so you can scroll through the results.
Select the settings icon to choose which report is displayed in the widget.