

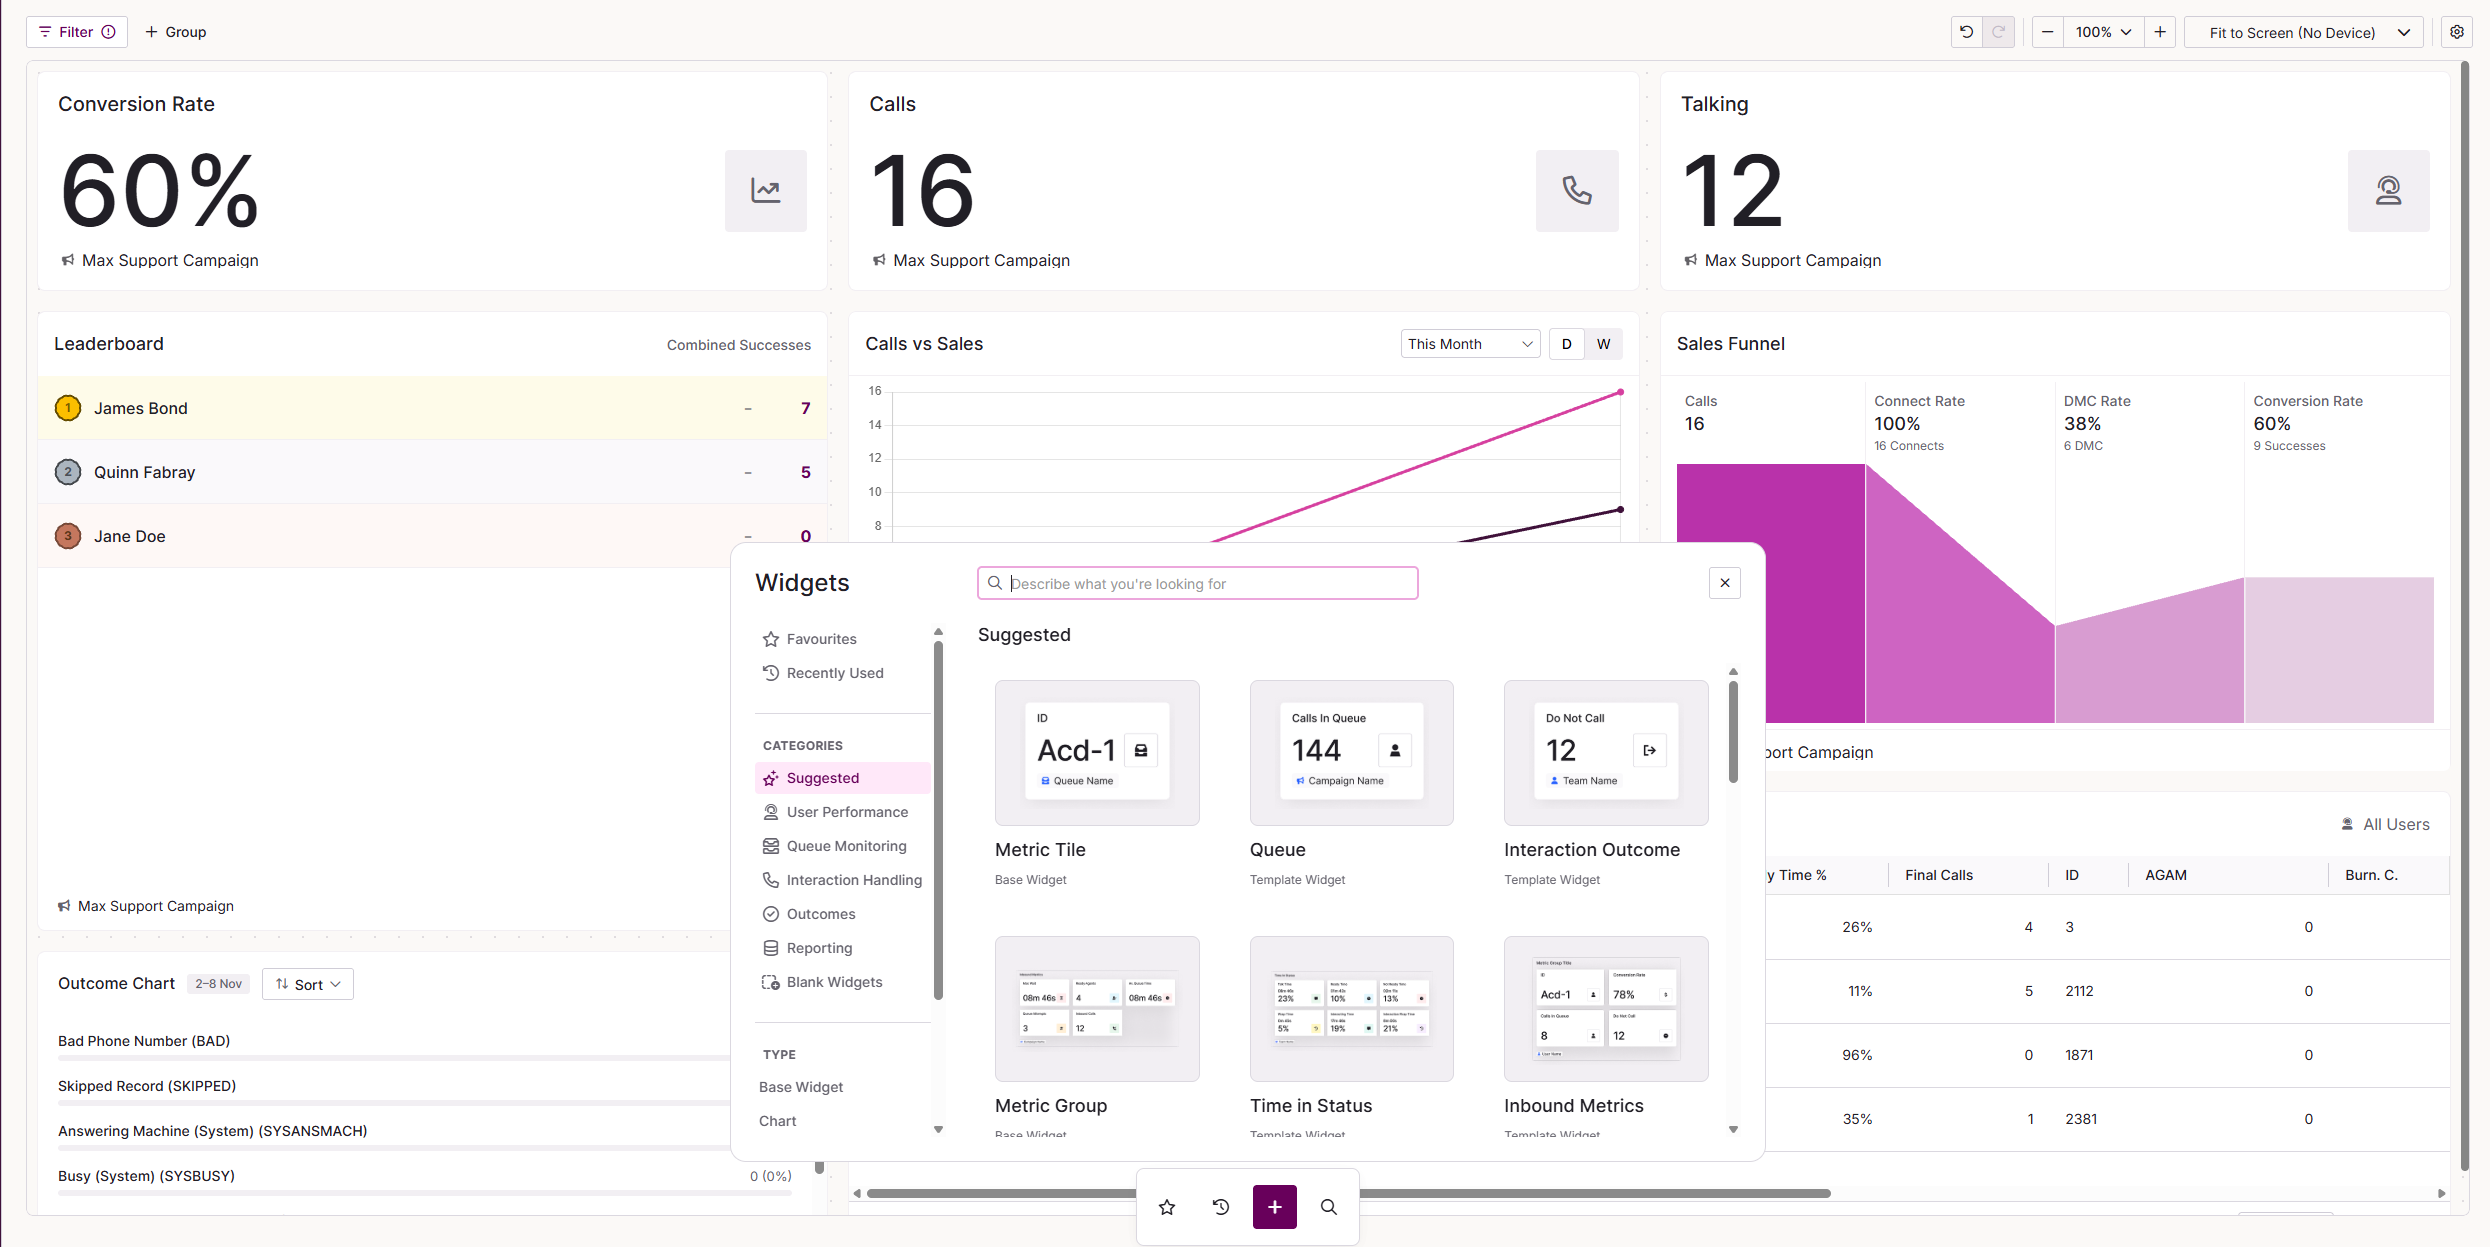
Dashboard Studio: Widgets
Widgets are the building blocks of your dashboards. Each one displays a specific type of live data, such as a single metric, a grid of users, a chart or a list of call outcomes. You add widgets from the widget library in Dashboard Studio, found in .
The widget library contains two types of widget:
- Base widgets are fully configurable. You choose the data and settings from scratch.
- Template widgets are base widgets with settings already applied, so you can get started faster. You can still change their settings once added.
When you select a widget on your dashboard, its settings open in two tabs. The Data tab controls what the widget shows. The Appearance tab controls fonts, colours and layout for that widget. This article covers both, starting with the Data tab for each widget, followed by Widget appearance.
Widgets at a glance
Select a widget name to jump to its settings.
| Widget | Type | What it shows |
|---|---|---|
| Metric Tile | Base | A single real-time metric, with an optional unit and trend. |
| Metric Group | Base | A group of metric tiles that share a data source and filter. |
| CTU List | Base | A scrollable, live list of campaigns, teams, users or lists, with up to three metrics each and quick actions. |
| User Info | Base | A live summary of user status for a campaign or team, such as logged in, talking, wrapping and ready. |
| User Status | Base | The live status breakdown of users in a campaign, shown as percentage rings. |
| Leaderboard | Base | Ranks users within a campaign or team by a selected metric. |
| Configurable Grid | Base | A scrollable table of live User, Team, List or Campaign data with columns you choose. |
| Chart | Base | Plots up to five live metrics as a column or line chart over time. |
| Funnel | Base | A four-stage outbound call funnel: Calls, Connect Rate, DMC Rate and Conversion Rate. |
| Outcome List | Base | A breakdown of call outcomes, with one row per outcome showing the count and percentage. |
| Outcome Chart | Base | A breakdown of call outcomes shown as a horizontal bar chart. |
| Report Grid | Base | The results of a saved report, shown as a paged, sortable grid. |
| Report List | Base | The results of a saved report, shown one row at a time as label and value pairs. |
| Banner | Base | A scrolling or static message, managed from the Banners page. |
| Free Text | Base | Your own formatted text, such as labels, instructions or tables. |
| Image | Base | A static image, or an image that changes with your dashboard filters. |
| Queue | Template | A Metric Tile set up for real-time queue statistics. |
| Interaction Outcome | Template | A Metric Tile set up to count how often an outcome (result code) is used, in real time. |
| Time in Status | Template | A Metric Group showing the percentage of time agents spend in each status. |
| Inbound Metrics | Template | A Metric Group showing inbound call queue statistics. |
| Filtered Calls | Template | A Configurable Grid listing live calls, filtered by call type and duration. |
| Breaks | Template | A Configurable Grid showing users on break, their allocated time and time remaining. |
| Outcome Activity | Template | A Configurable Grid showing how many times each outcome has been used, per campaign, team, user or list. |
| Queues | Template | A Configurable Grid showing interaction queues with SLA and abandonment metrics. |
Base widgets
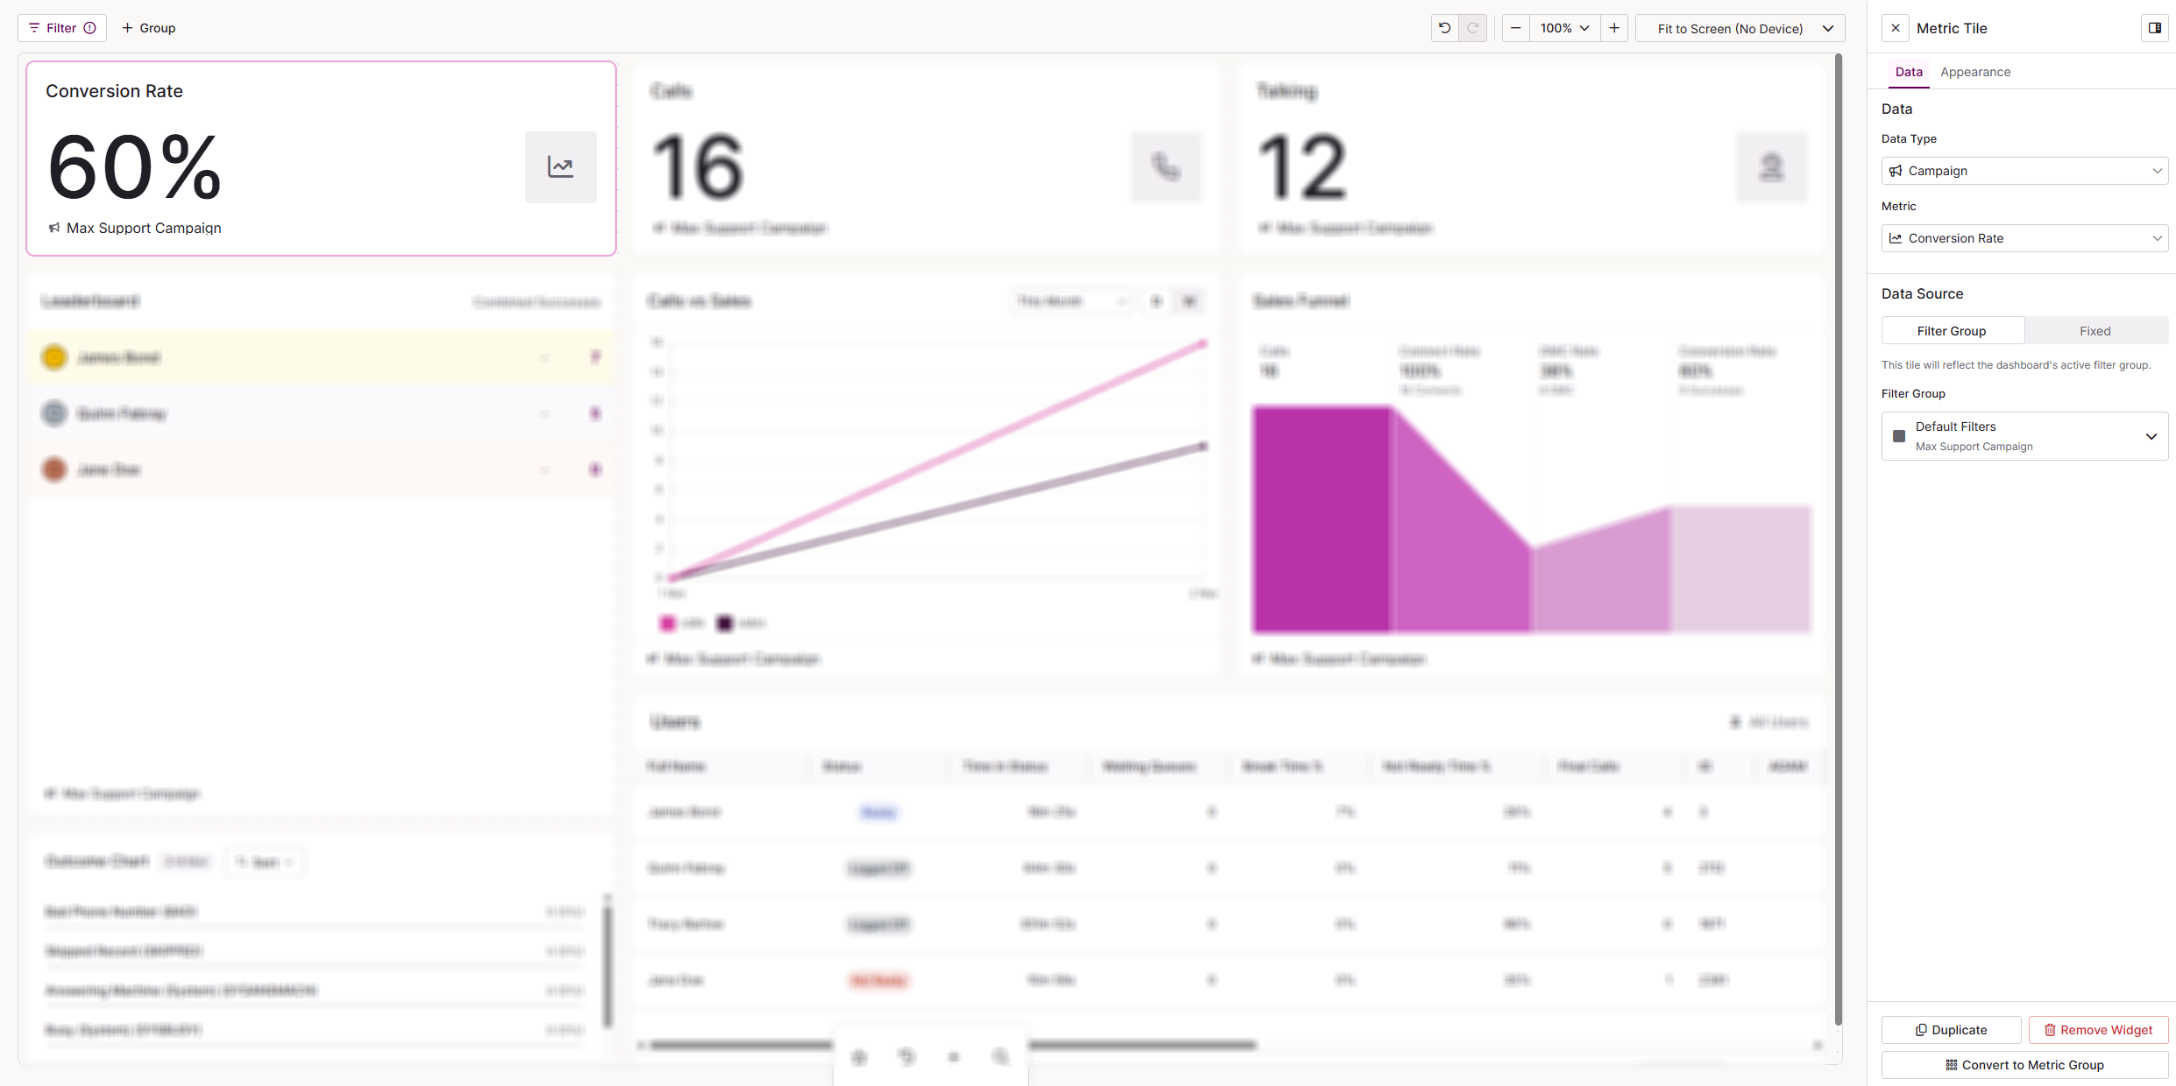
The Metric Tile displays a single real-time metric, so you can keep one key number front and centre.
| Setting | Description |
|---|---|
| Data Type | The data the metric is based on. Choose from User, Campaign, List, Team or Queue. |
| Metric | The metric the tile displays. The available metrics depend on the Data Type you choose. |
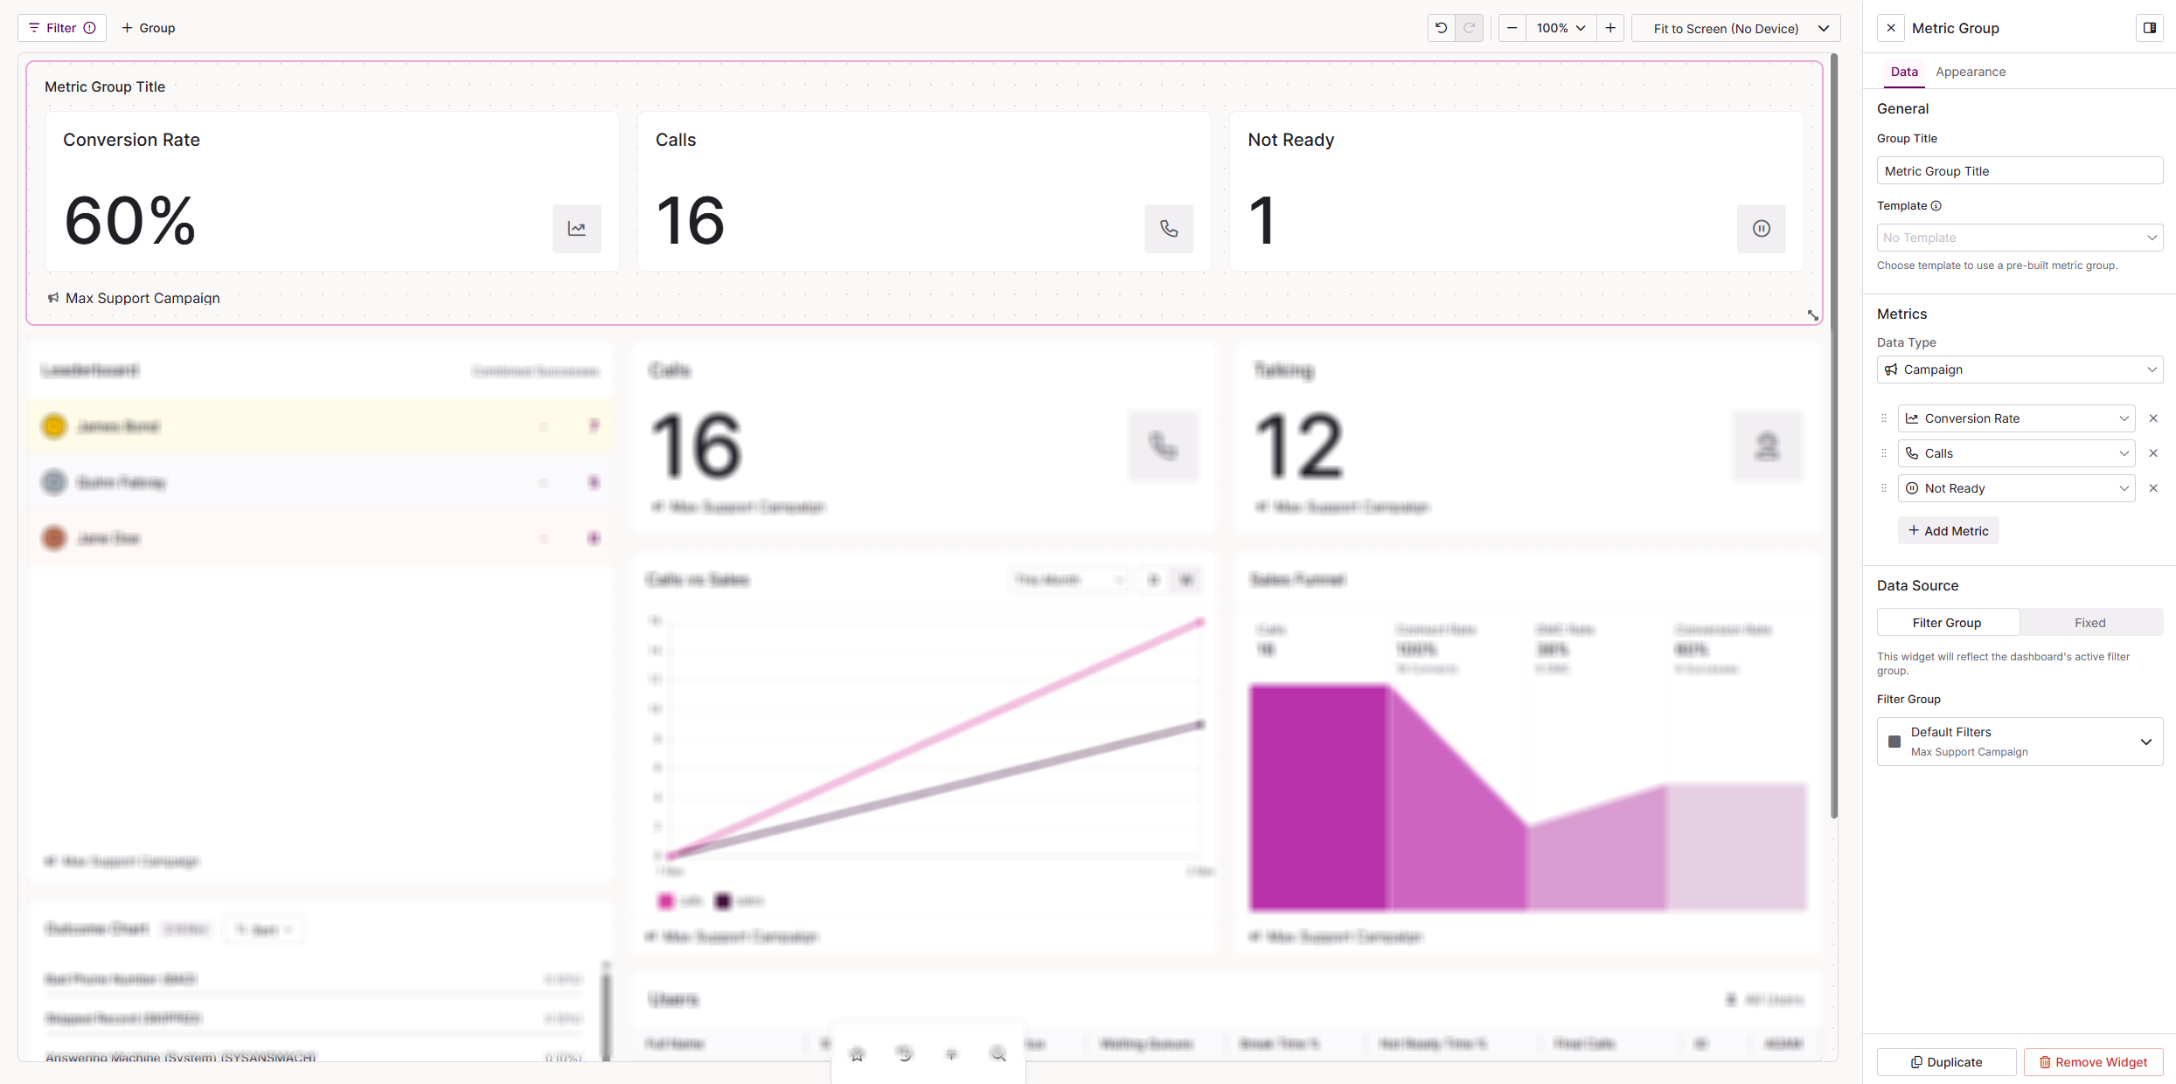
The Metric Group displays several metric tiles together, all using the same data source and filter. Use it when you want a set of related numbers side by side without adding and configuring separate Metric Tiles.
| Setting | Description |
|---|---|
| Group Title | The name of the widget as shown on your dashboard. |
| Template | Pre-populates the metrics for you. Choose from No Template, Time in Status or Inbound Metrics. |
| Data Type | The data the metrics are based on. Choose from User, Campaign, List, Team or Queue. |
| Metrics | Select Add Metric to add a metric to the group. Drag metrics to reorder them, or remove any you do not want to display. |
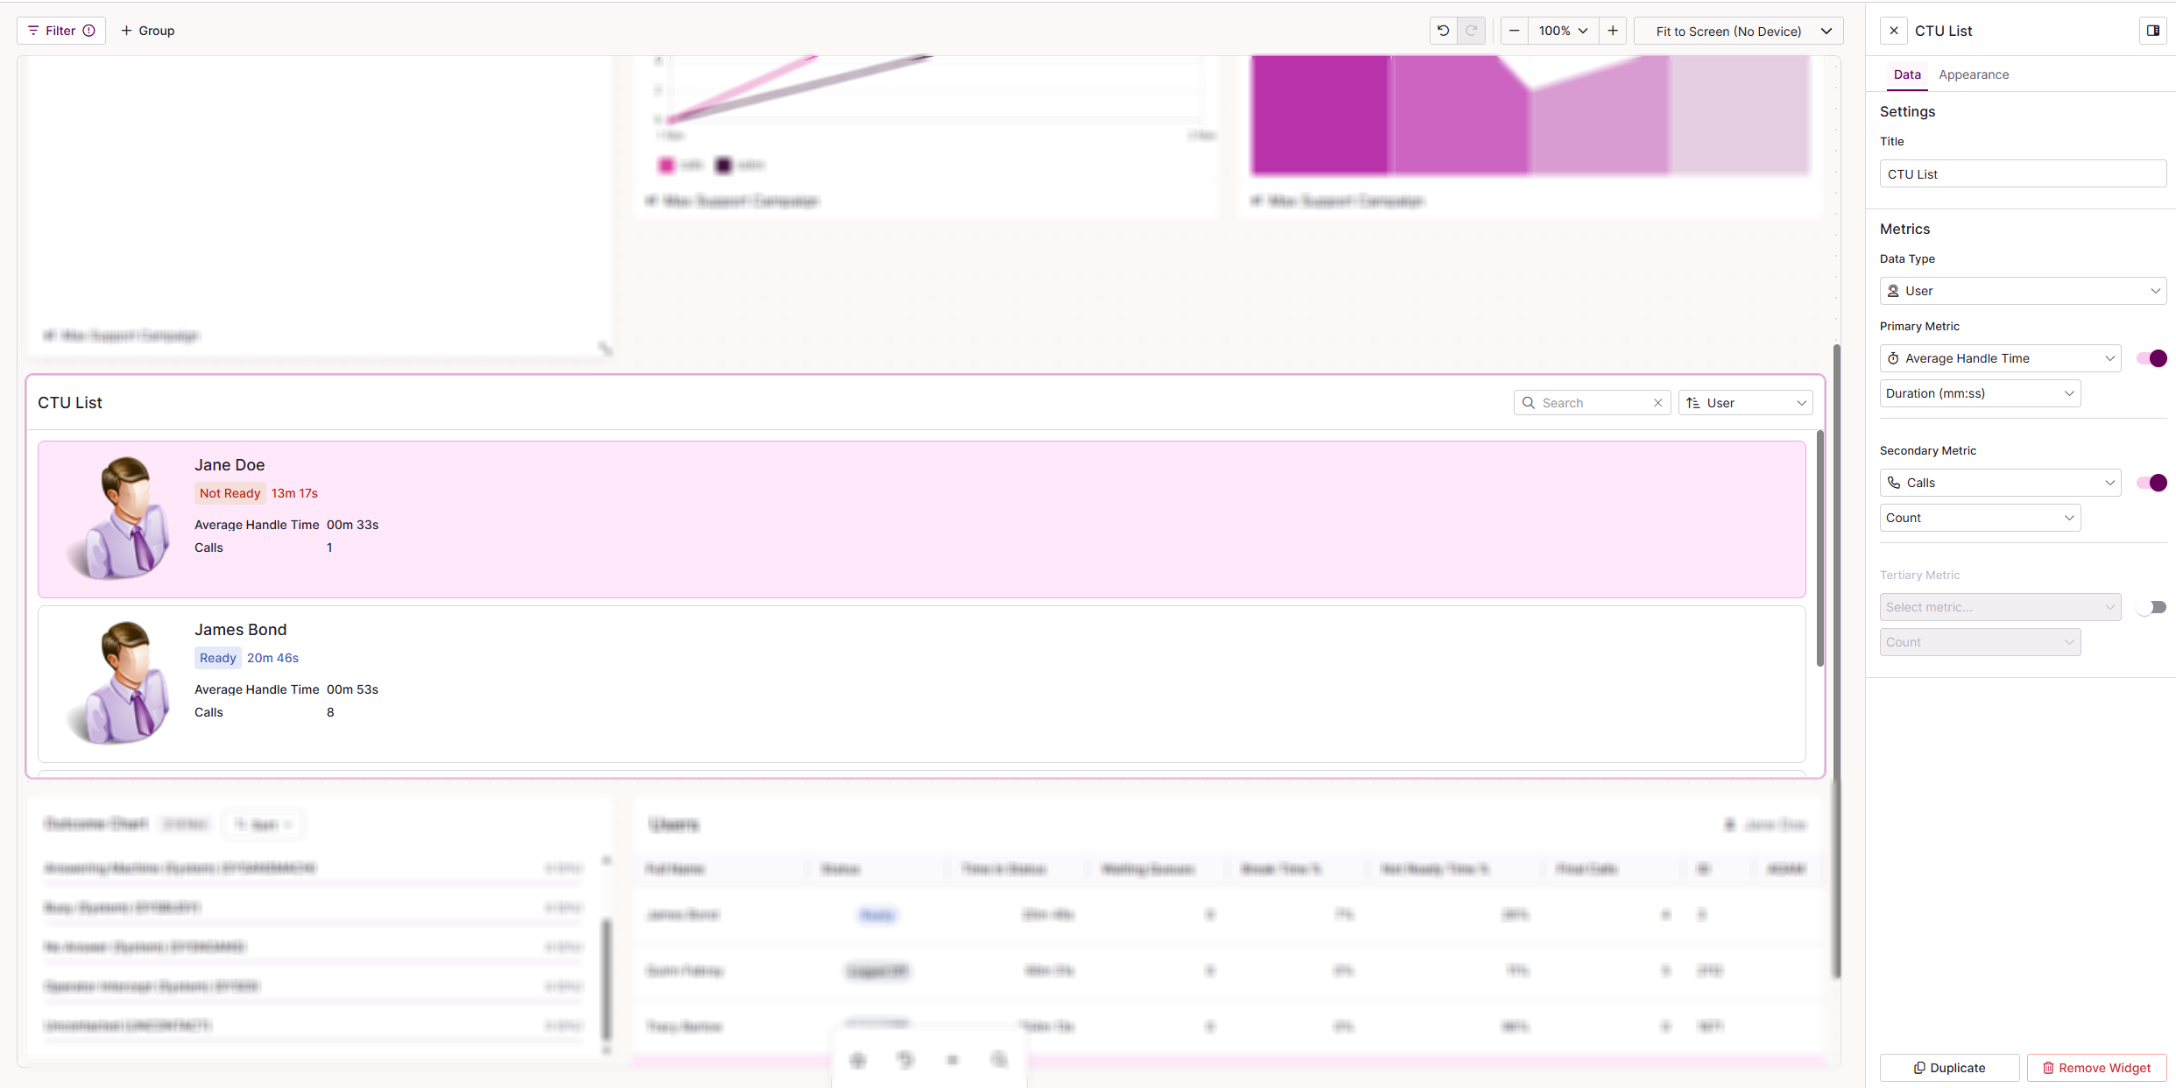
The CTU List shows a scrollable, live list of cards for your campaigns, teams, users or lists. Each card displays up to three metrics, and you can take supervisor actions directly from the list.
| Setting | Description |
|---|---|
| Data Type | The type of entity shown in the list. Choose from Campaign, Team, User or List. |
| Primary Metric | The main metric shown on each card. Use the toggle to show or hide it. |
| Secondary Metric | A second metric shown on each card. Use the toggle to show or hide it. |
| Tertiary Metric | A third metric shown on each card. Use the toggle to show or hide it. |
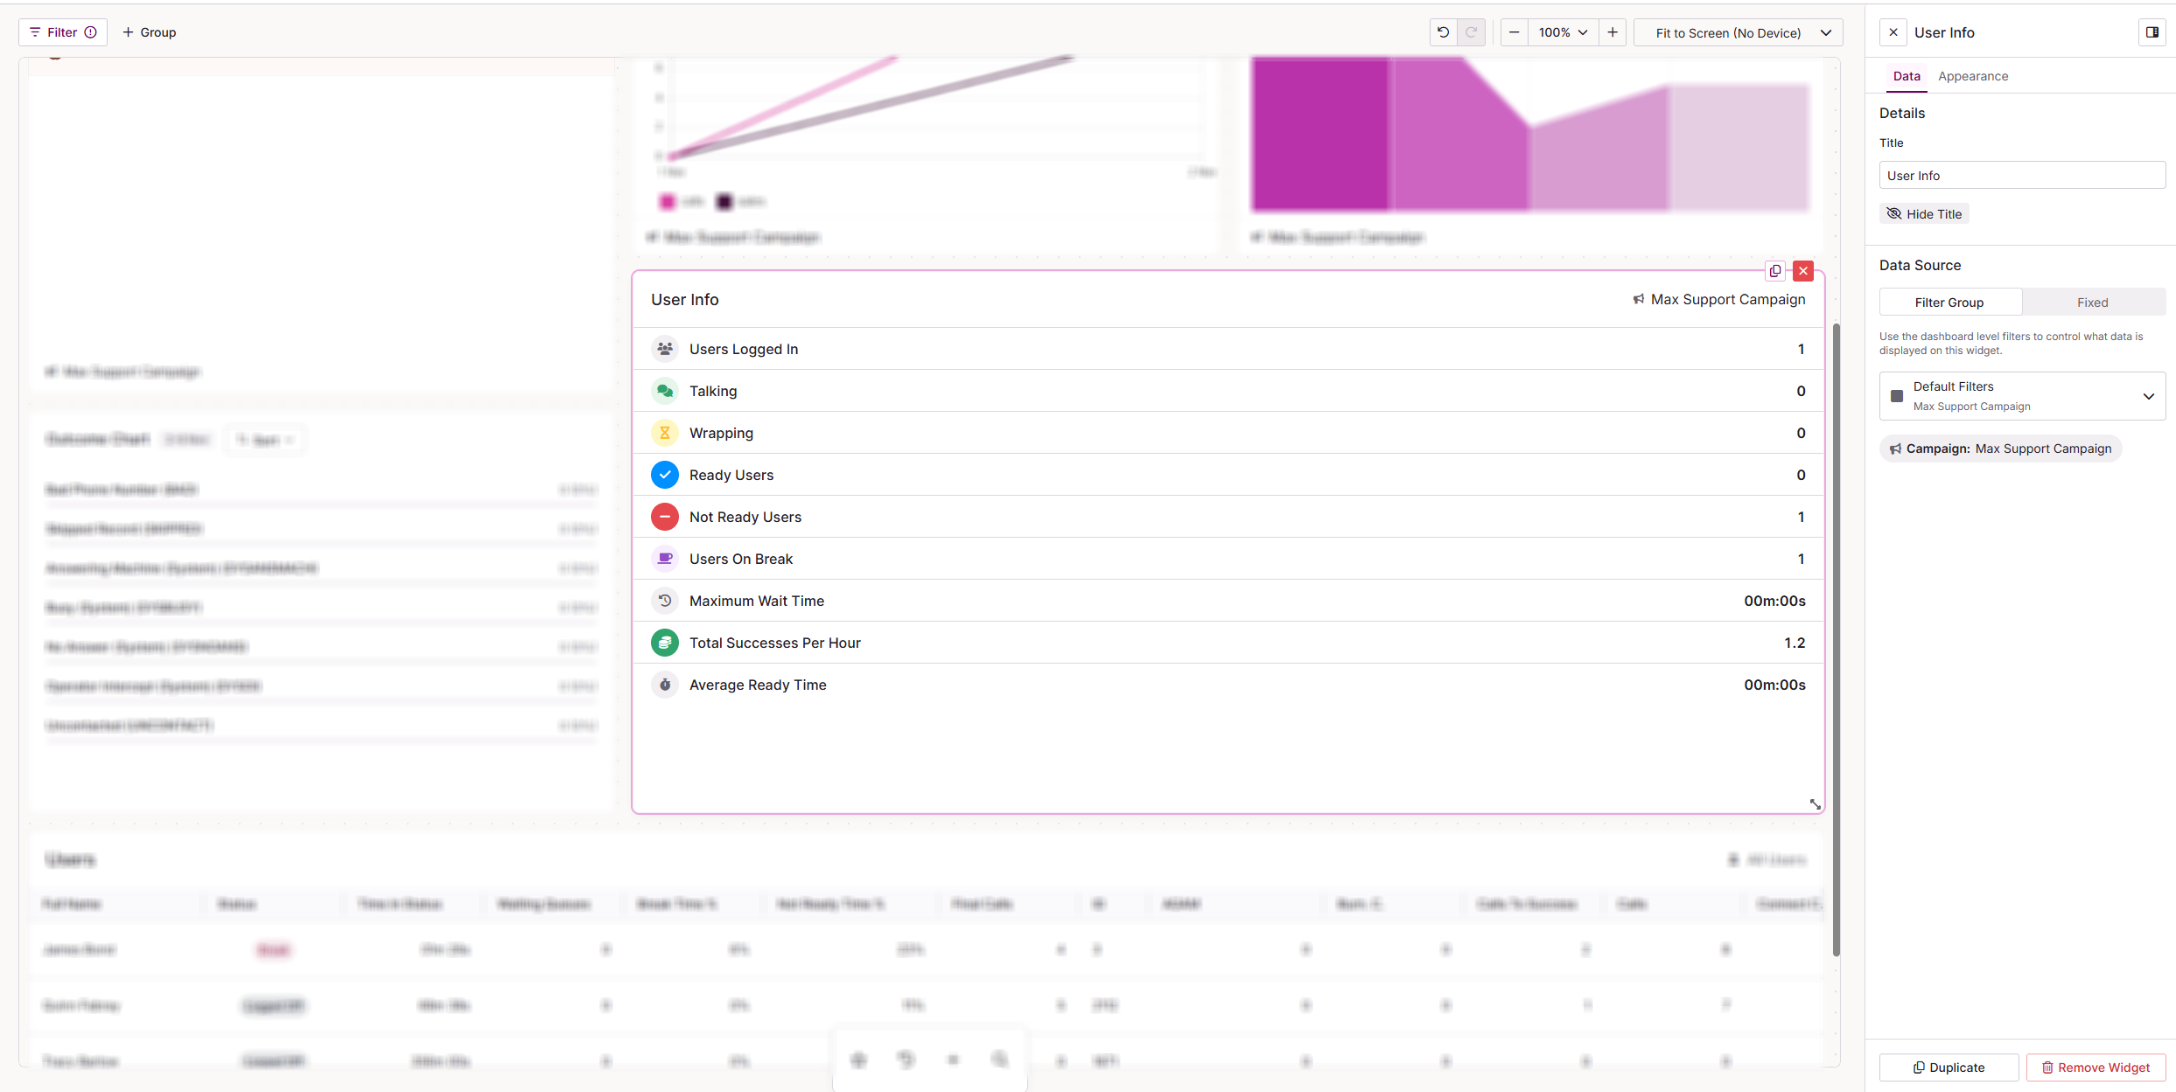
User Info gives a live summary of user status for a campaign, including how many agents are logged in, talking, wrapping and ready.
| Setting | Description |
|---|---|
| Source | Choose where the widget gets its data. Select Filter to use one of the filters set up on your dashboard, or Fixed to set a specific campaign on the widget. |
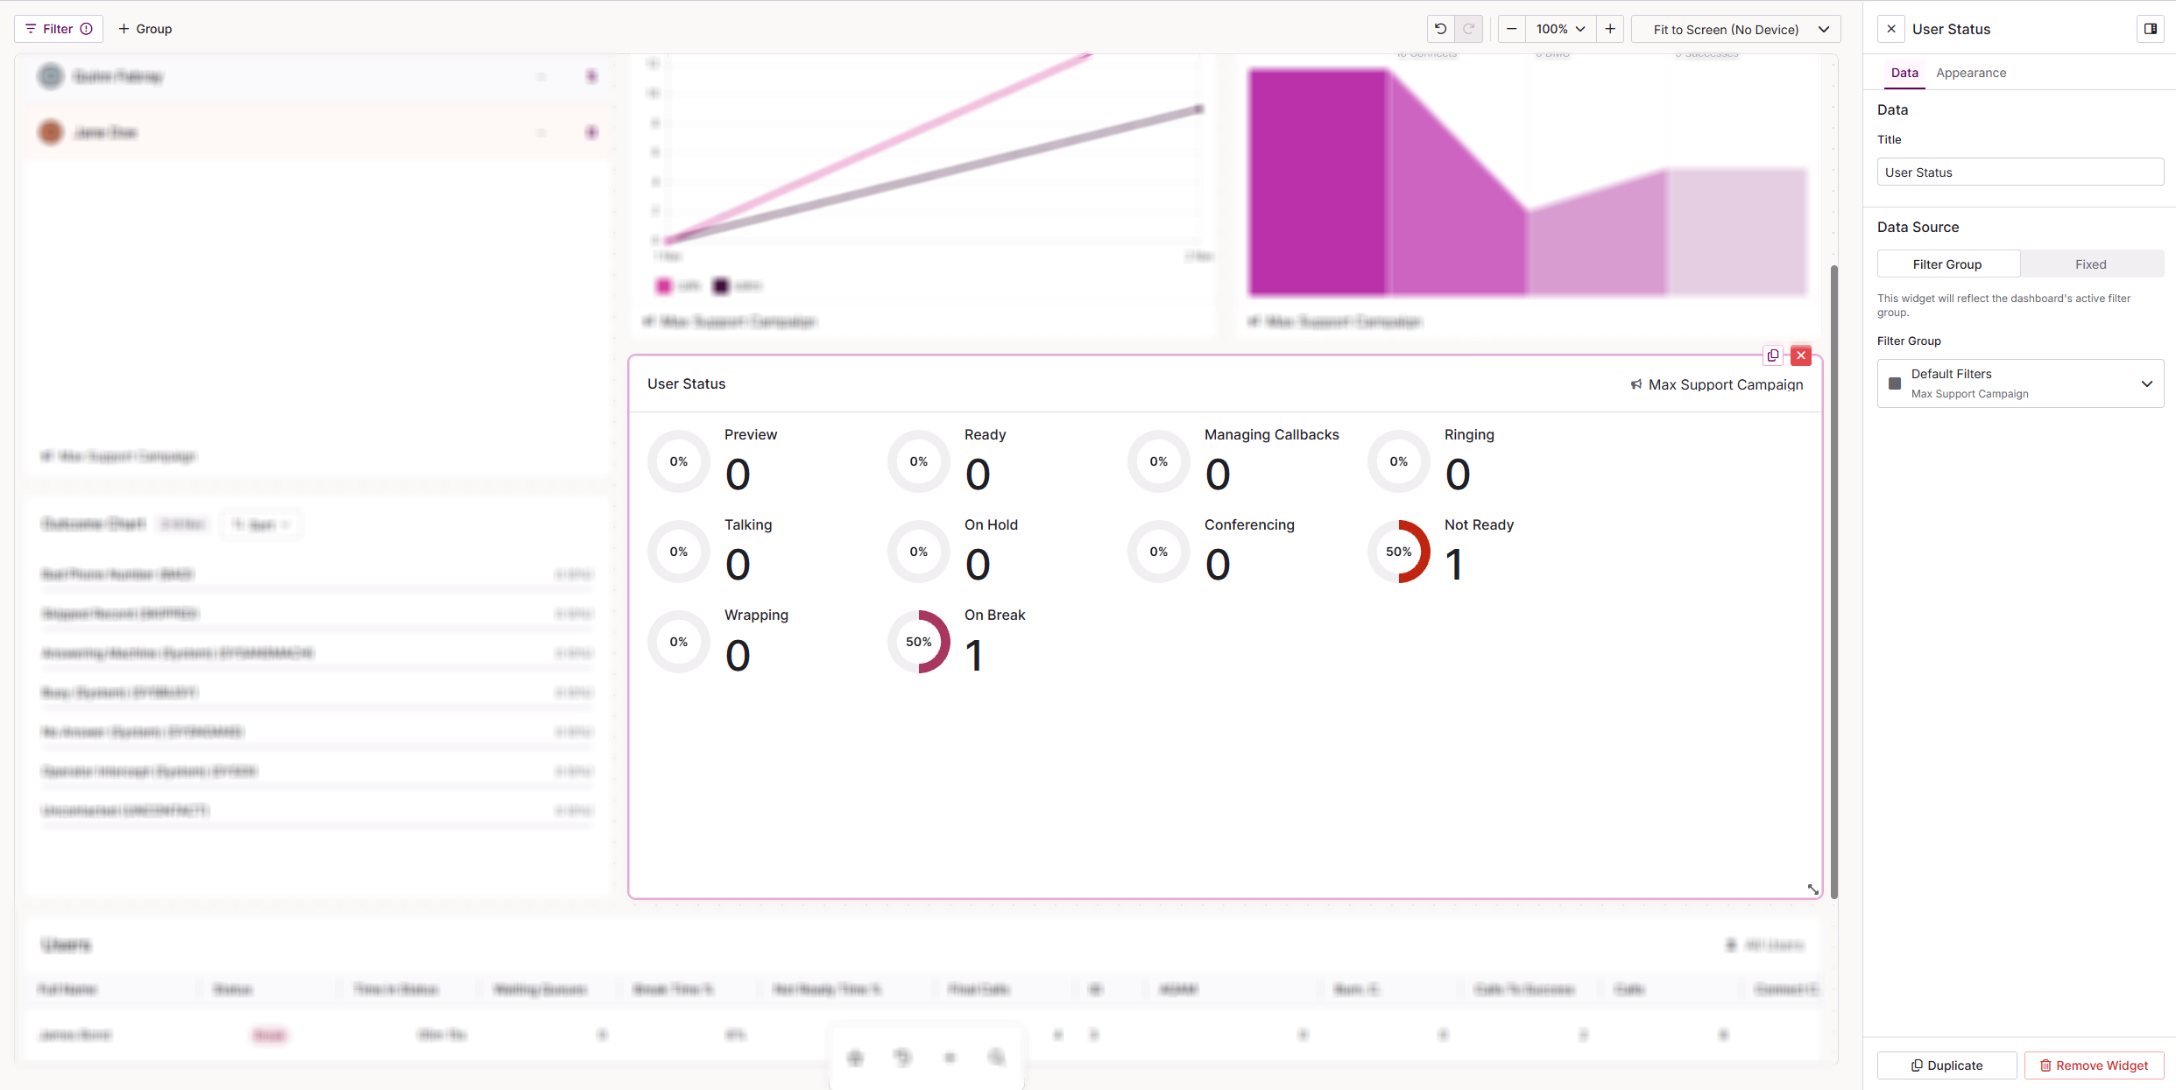
User Status shows the live status breakdown of users in a campaign as percentage rings, so you can see at a glance how your agents are spending their time.
| Setting | Description |
|---|---|
| Title | The name shown at the top of the widget on your dashboard. |
| Source | Choose where the widget gets its data. Select Filter Group to use one of the filters set up on your dashboard, or Fixed to set a specific campaign on the widget. |
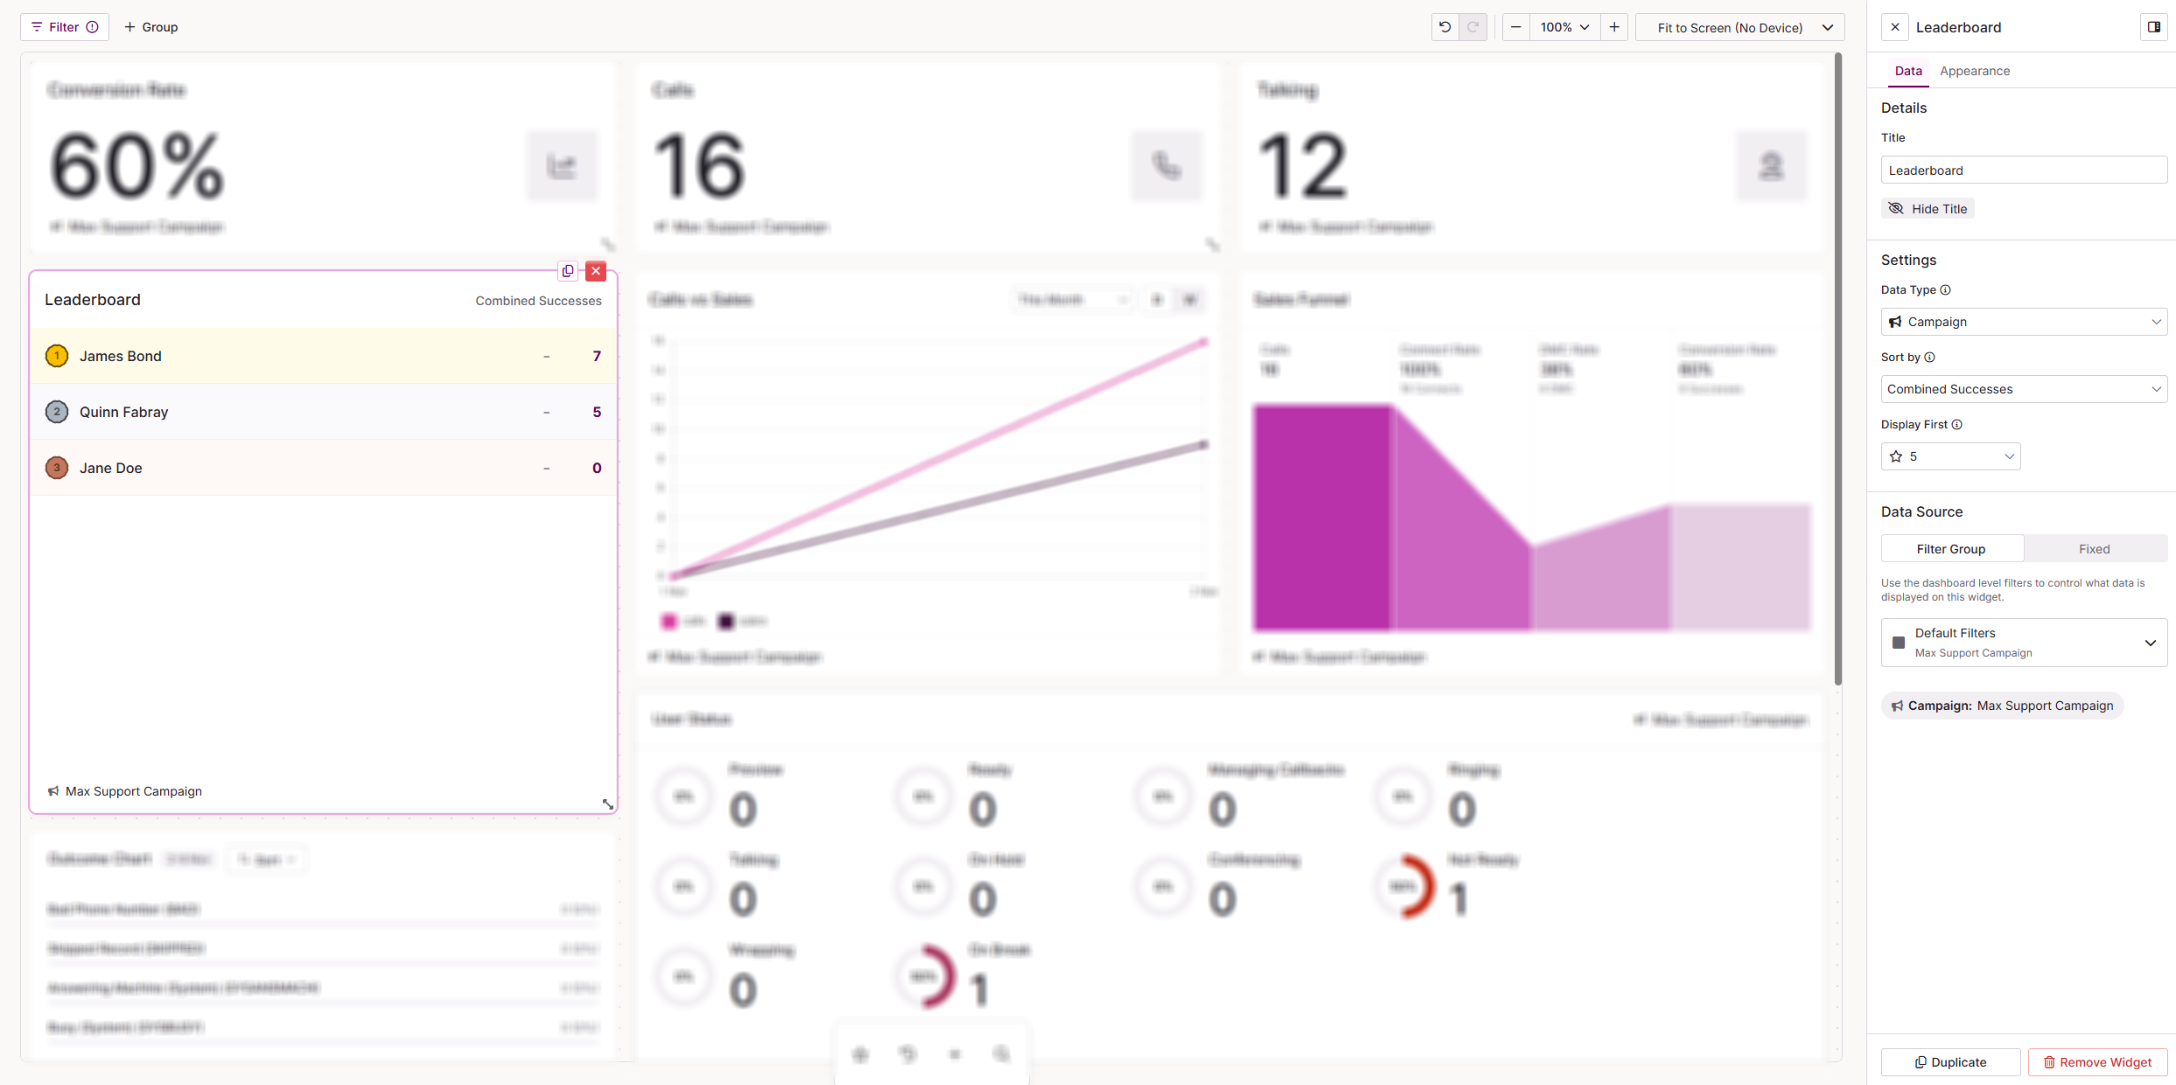
The Leaderboard ranks users within a campaign or team by a selected metric. You can show names, a podium, photos or initials, or a bar chart.
| Setting | Description |
|---|---|
| Title | The name shown at the top of the leaderboard on your dashboard. |
| Data Type | Choose whether to rank users within a Campaign or a Team. |
| Sort By | The metric used to rank users. Choose from Combined Successes or Revenue. |
| Display First | How many users appear on the leaderboard. Choose from 5 to 25, in steps of 5. |
| Source | Choose where the widget gets its data. Select Filter to use one of the filters set up on your dashboard, or Fixed to set a specific campaign on the widget. |
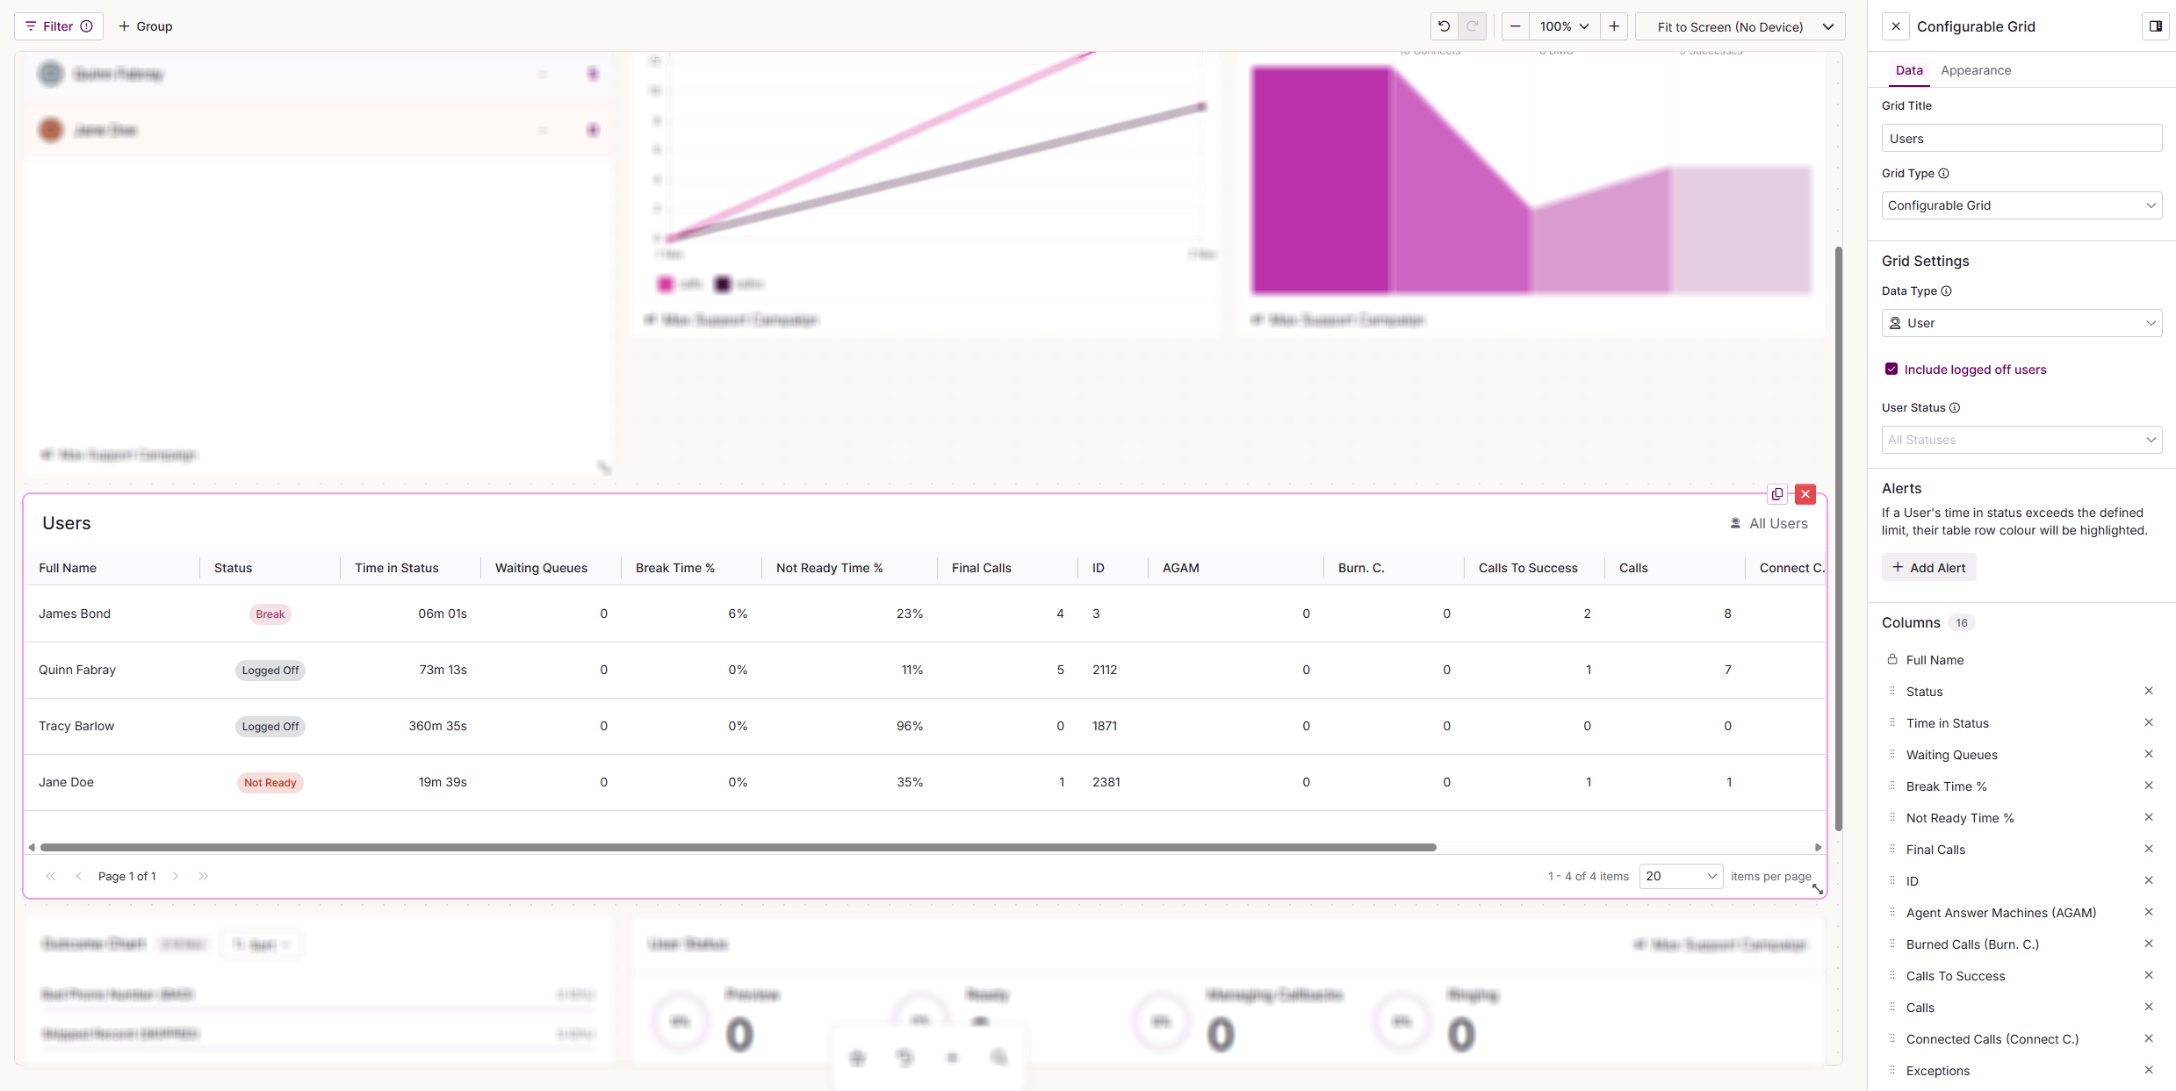
The Configurable Grid is a scrollable table of live data for your users, teams, lists or campaigns. You choose which columns appear and in what order.
| Setting | Description |
|---|---|
| Grid Title | The name shown at the top of the grid on your dashboard. |
| Grid Type | Changes the grid layout and behaviour. Choose from Configurable Grid, Filtered Calls, Breaks, Outcome Activity or Queues. |
| Data Type | The data shown in each row. Choose from User, Campaign, Team or List. |
| Columns | Lists the columns currently in the grid. Drag to reorder them, or remove any you do not need. Select Manage Columns to add new ones. |
For the full list of columns available for each data type, see Dashboard Studio: Configurable Grid Stats by Data Type.
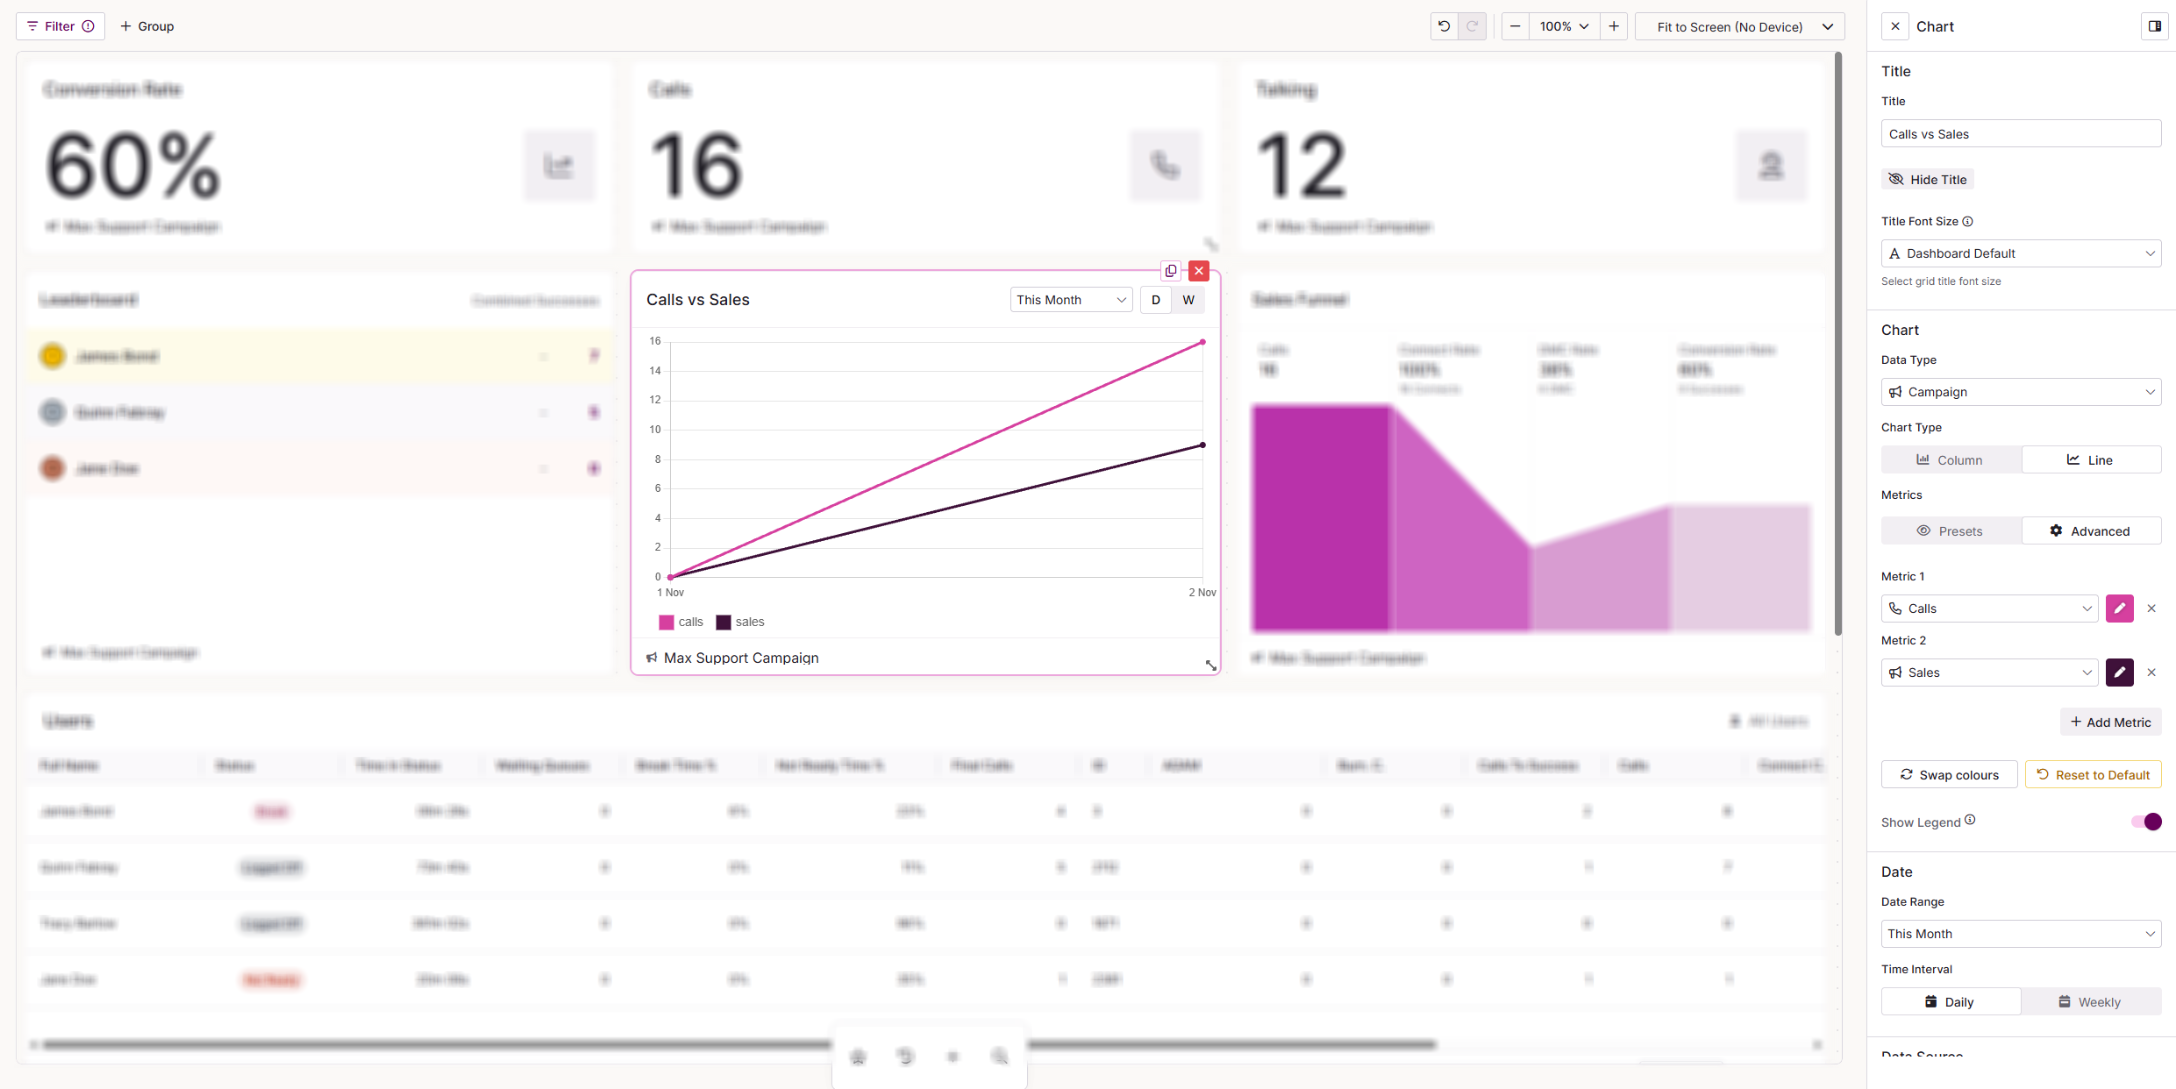
The Chart plots up to five live metrics over time as a column or line chart. Font options for this widget sit in the Data tab, as it does not have an Appearance tab.
| Setting | Description |
|---|---|
| Title | The name shown at the top of the widget on your dashboard. Select Hide Title to remove it from view. |
| Title Font Size | The size of the widget title. Choose from Dashboard Default, Extra Small (12), Small (14), Medium (16), Large (20) or Custom. |
| Data Type | The data the chart is based on. Choose from User, Campaign, Team or List. |
| Chart Type | Choose a Column or Line chart. |
| Metrics | Choose Preset to pick from ready-made metric pairs, or Advanced to choose your own metrics and their colours. |
| Metric Pair | Only visible when Metrics is set to Preset. Choose from Calls vs Connects, Connects vs Contacts, Contacts vs Sales, Calls vs Sales, or Right Party Contacts vs Sales. |
| Advanced metrics | Only visible when Metrics is set to Advanced. Choose from Calls, Connects, Contacts, Right Party Contacts and Sales, and set the colour for each. |
| Show Legend | Shows a key that matches each colour on the chart to its metric. |
| Date Range | The period the chart covers. Choose from This Week, This Month, This Quarter or This Year. |
| Time Interval | How the data is grouped on the chart. Choose from Daily or Weekly. |
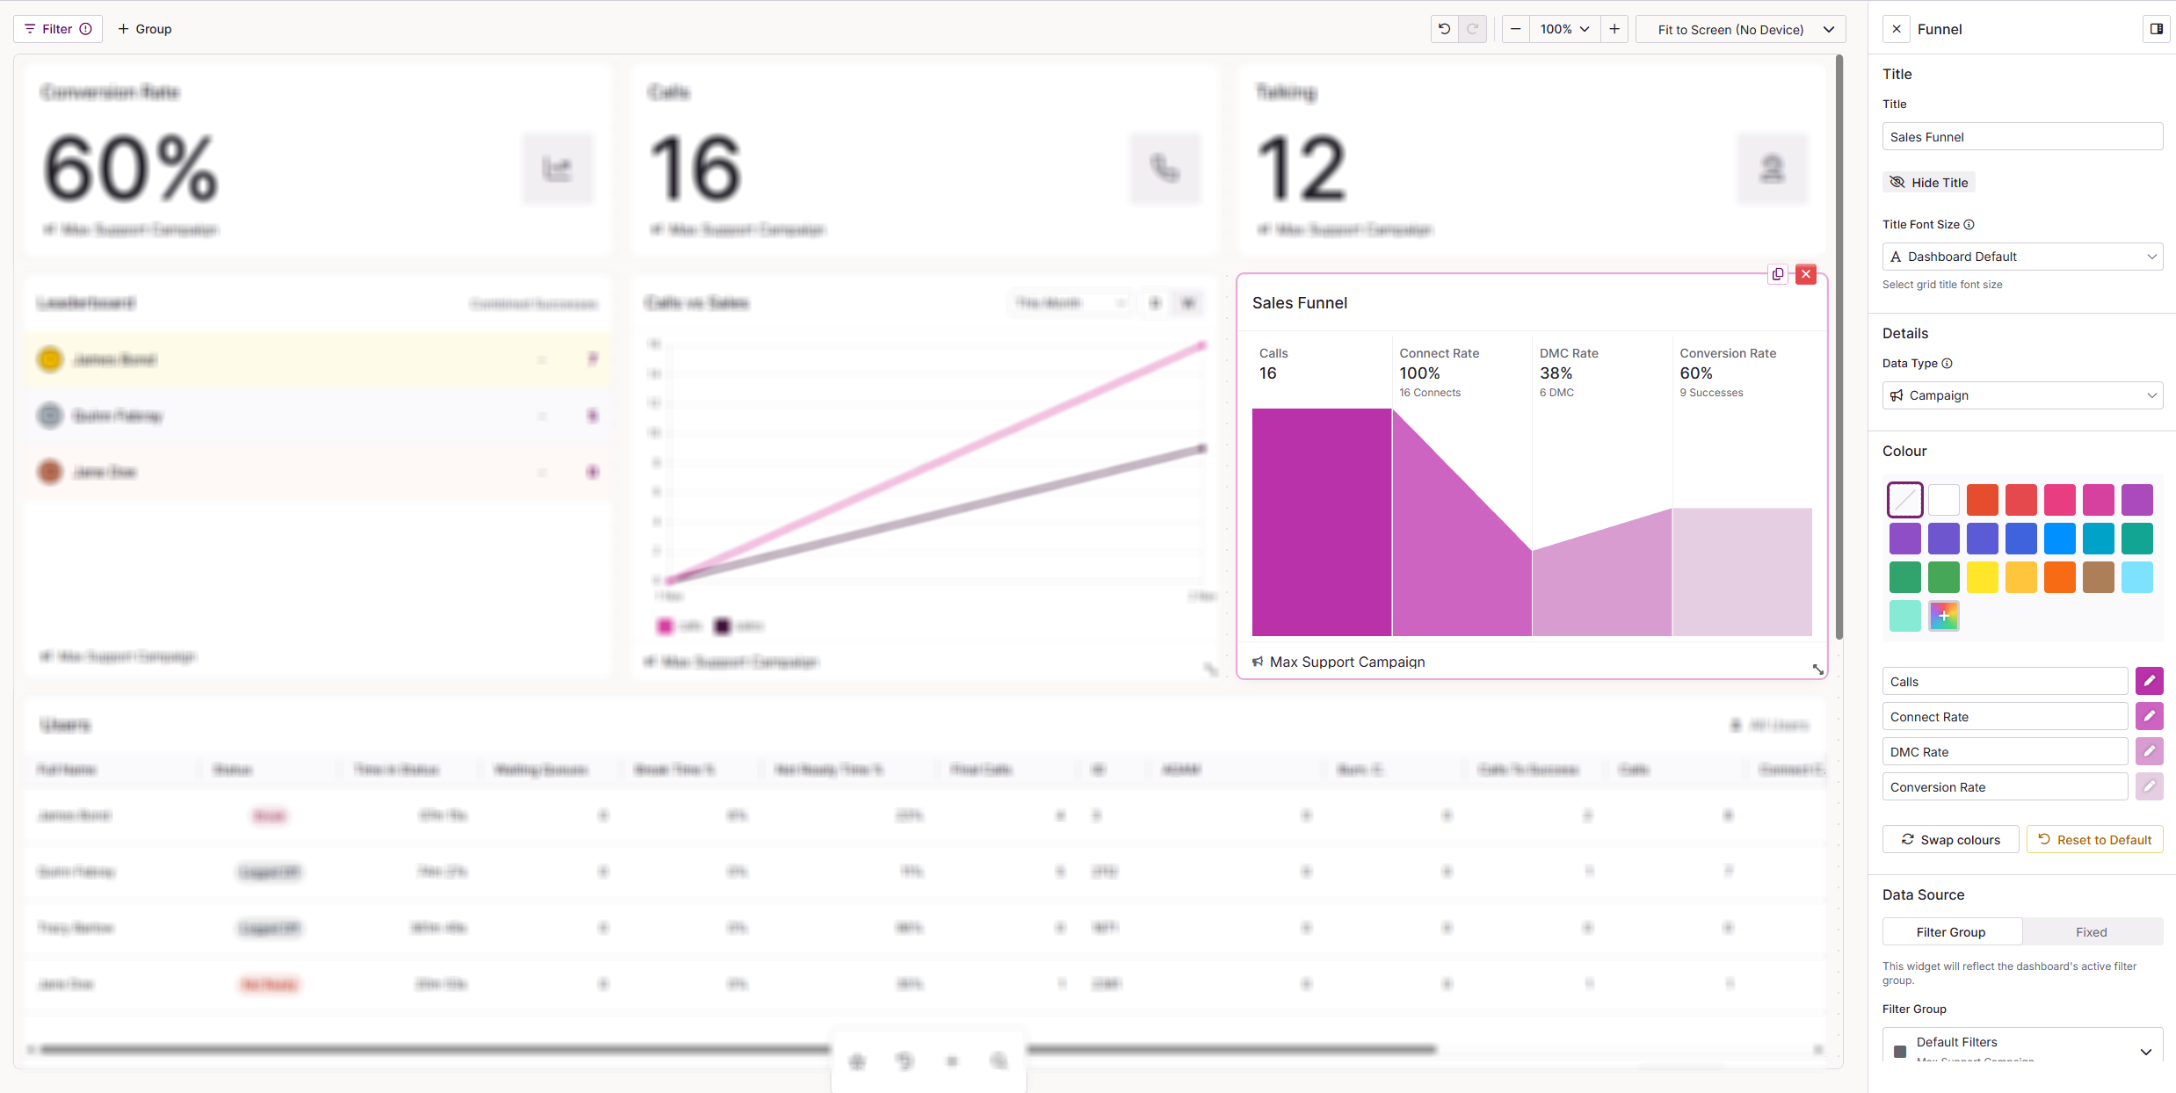
The Funnel shows a fixed four-stage view of your outbound calls: Calls, Connect Rate, DMC Rate and Conversion Rate.
| Setting | Description |
|---|---|
| Title | The name shown at the top of the widget on your dashboard. Select Hide Title to remove it from view. |
| Title Font Size | The size of the widget title. Choose from Dashboard Default, Extra Small (12), Small (14), Medium (16), Large (20) or Custom. |
| Data Type | The data the funnel is based on. Choose from User, Campaign, List or Team. |
| Colour | The colour used for the funnel. You can also change the shade for each stage. |
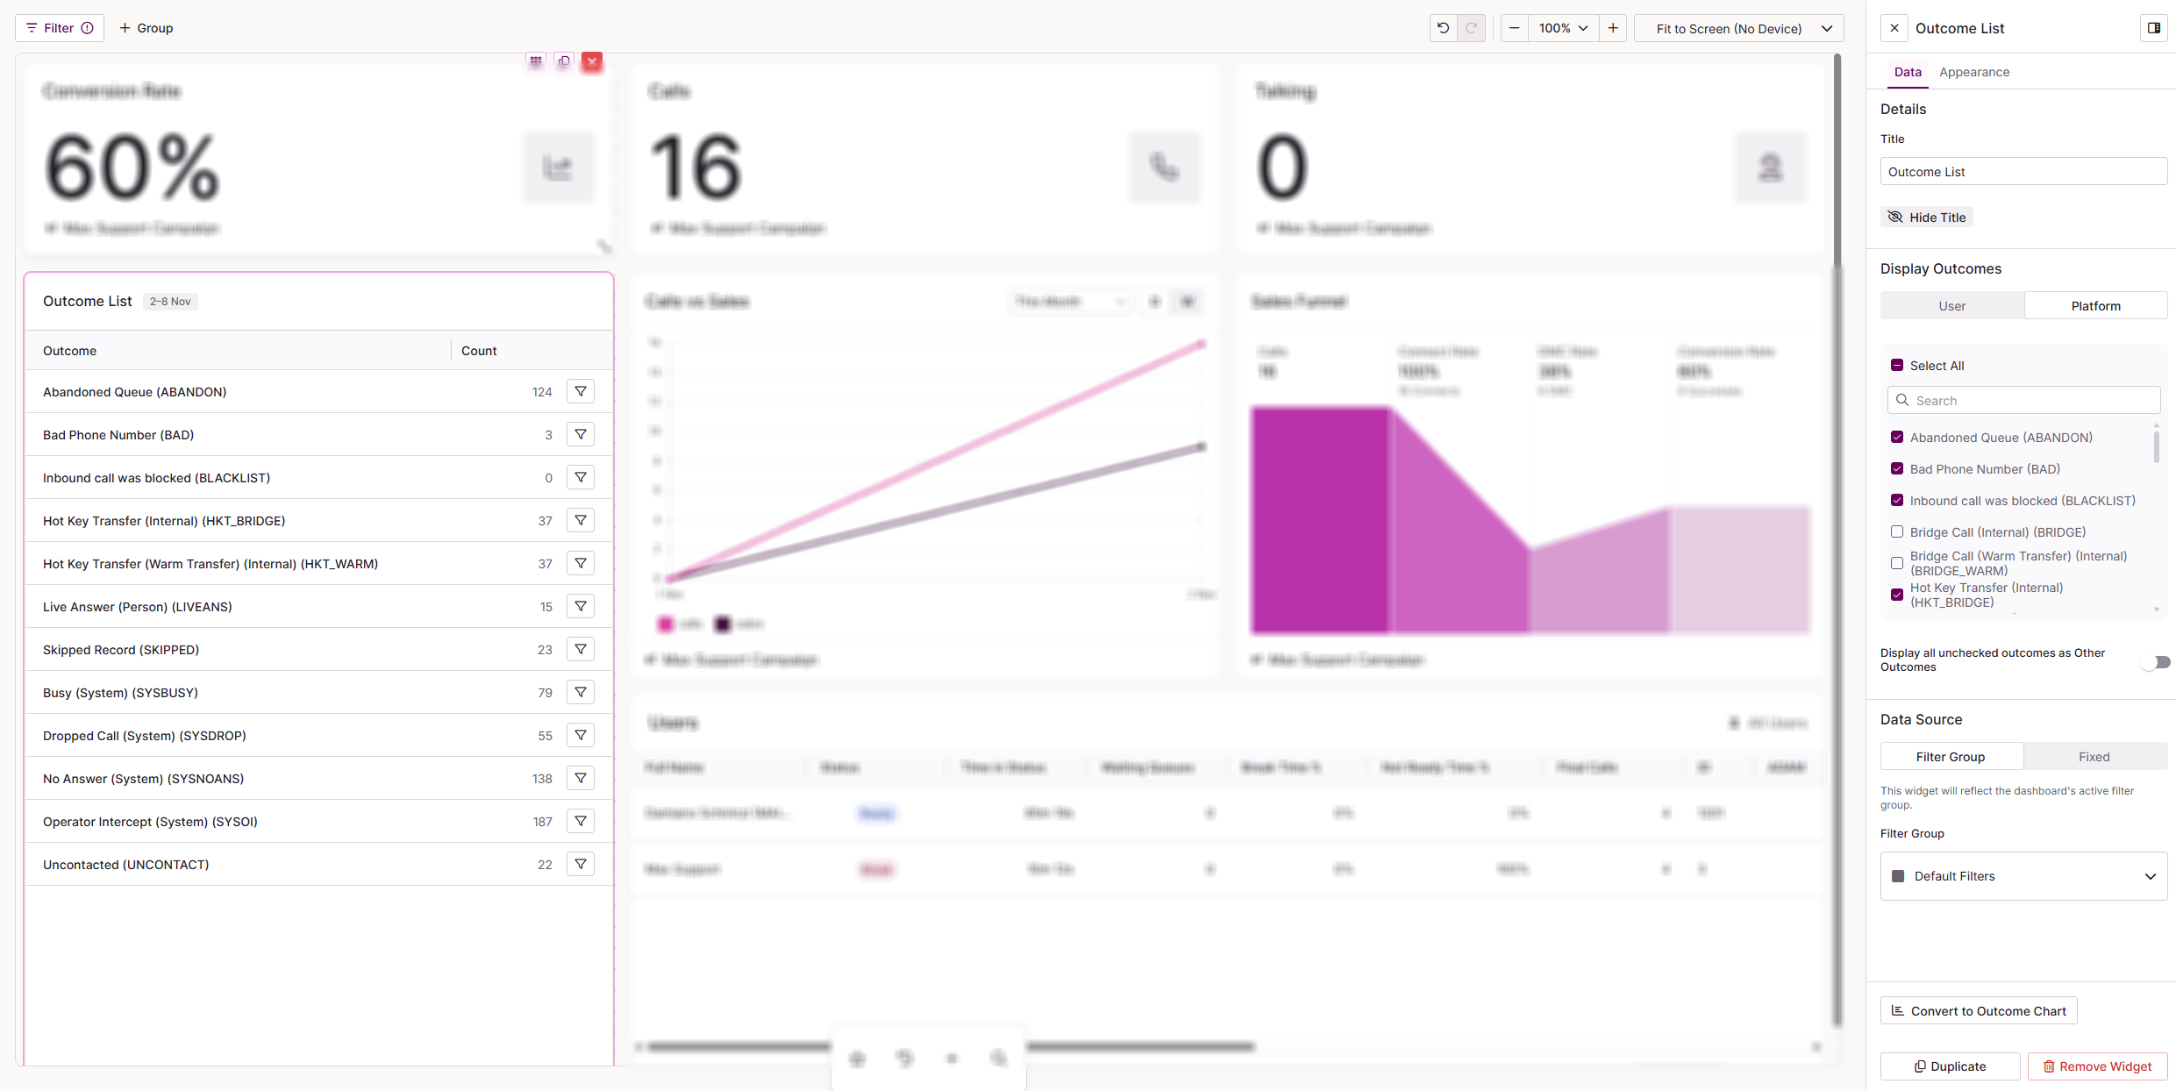 Outcome List
The Outcome List shows a breakdown of call outcomes, with one row per outcome and its count.
| Setting | Description |
|---|---|
| Title | The name shown at the top of the widget on your dashboard. Select Hide Title to remove it from view. |
| Display Outcomes | Choose which outcomes to include. The User tab lists your active user outcomes. The System tab lists the active system outcomes (system result codes) that the system can apply. Tick or untick each outcome, or use the search to find one. |
| Display all unchecked outcomes as Other Outcomes | When switched on, any outcome you have not ticked is grouped together as Other Outcomes. |
| Convert to Outcome Chart | Switches the widget to an Outcome Chart, keeping your settings. |
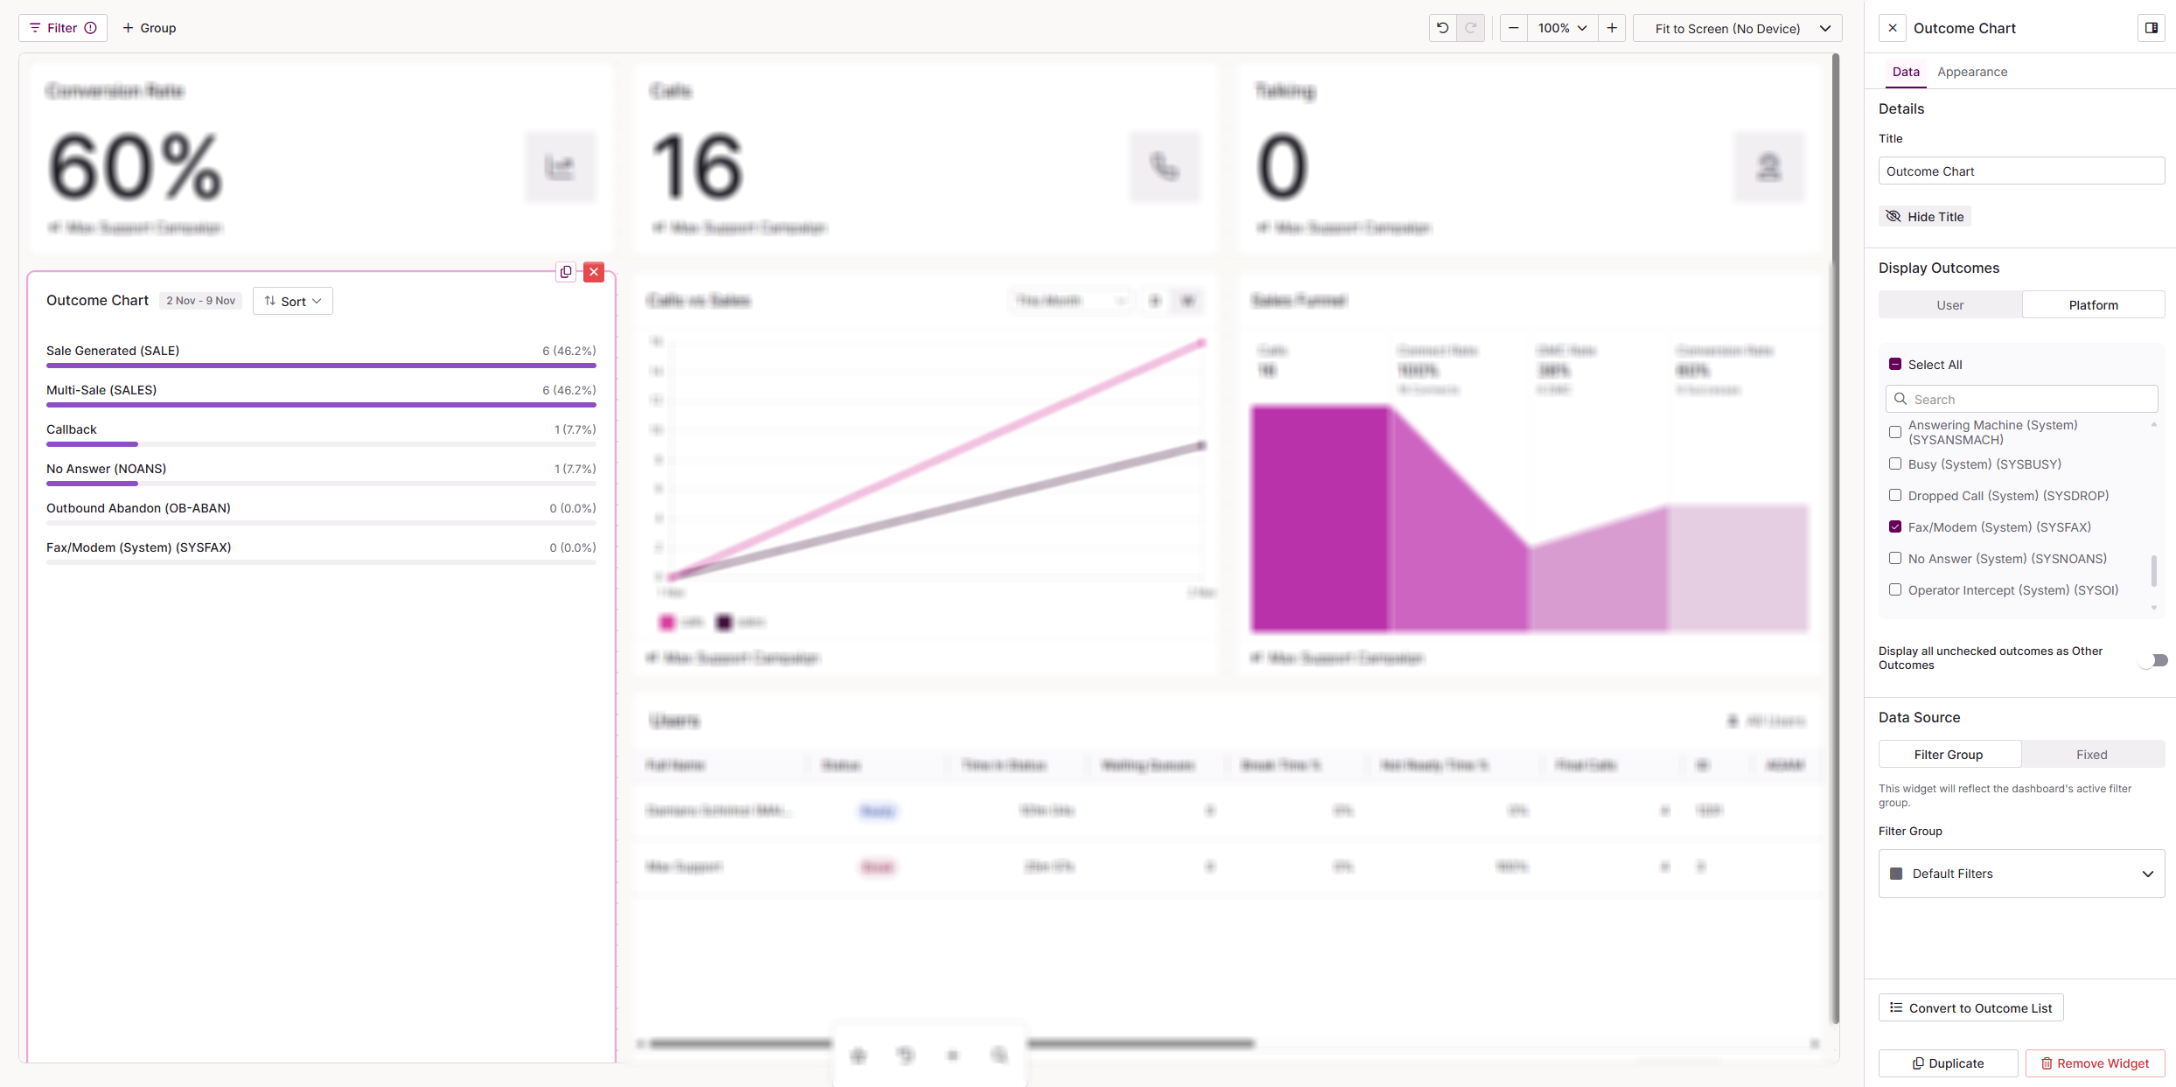 Outcome Chart
The Outcome Chart shows the same breakdown of call outcomes as a horizontal bar chart.
| Setting | Description |
|---|---|
| Title | The name shown at the top of the widget on your dashboard. Select Hide Title to remove it from view. |
| Display Outcomes | Choose which outcomes to include. The User tab lists your active user outcomes. The System tab lists the active system outcomes (system result codes) that the system can apply. Tick or untick each outcome, or use the search to find one. |
| Display all unchecked outcomes as Other Outcomes | When switched on, any outcome you have not ticked is grouped together as Other Outcomes. |
| Convert to Outcome List | Switches the widget to an Outcome List, keeping your settings. |
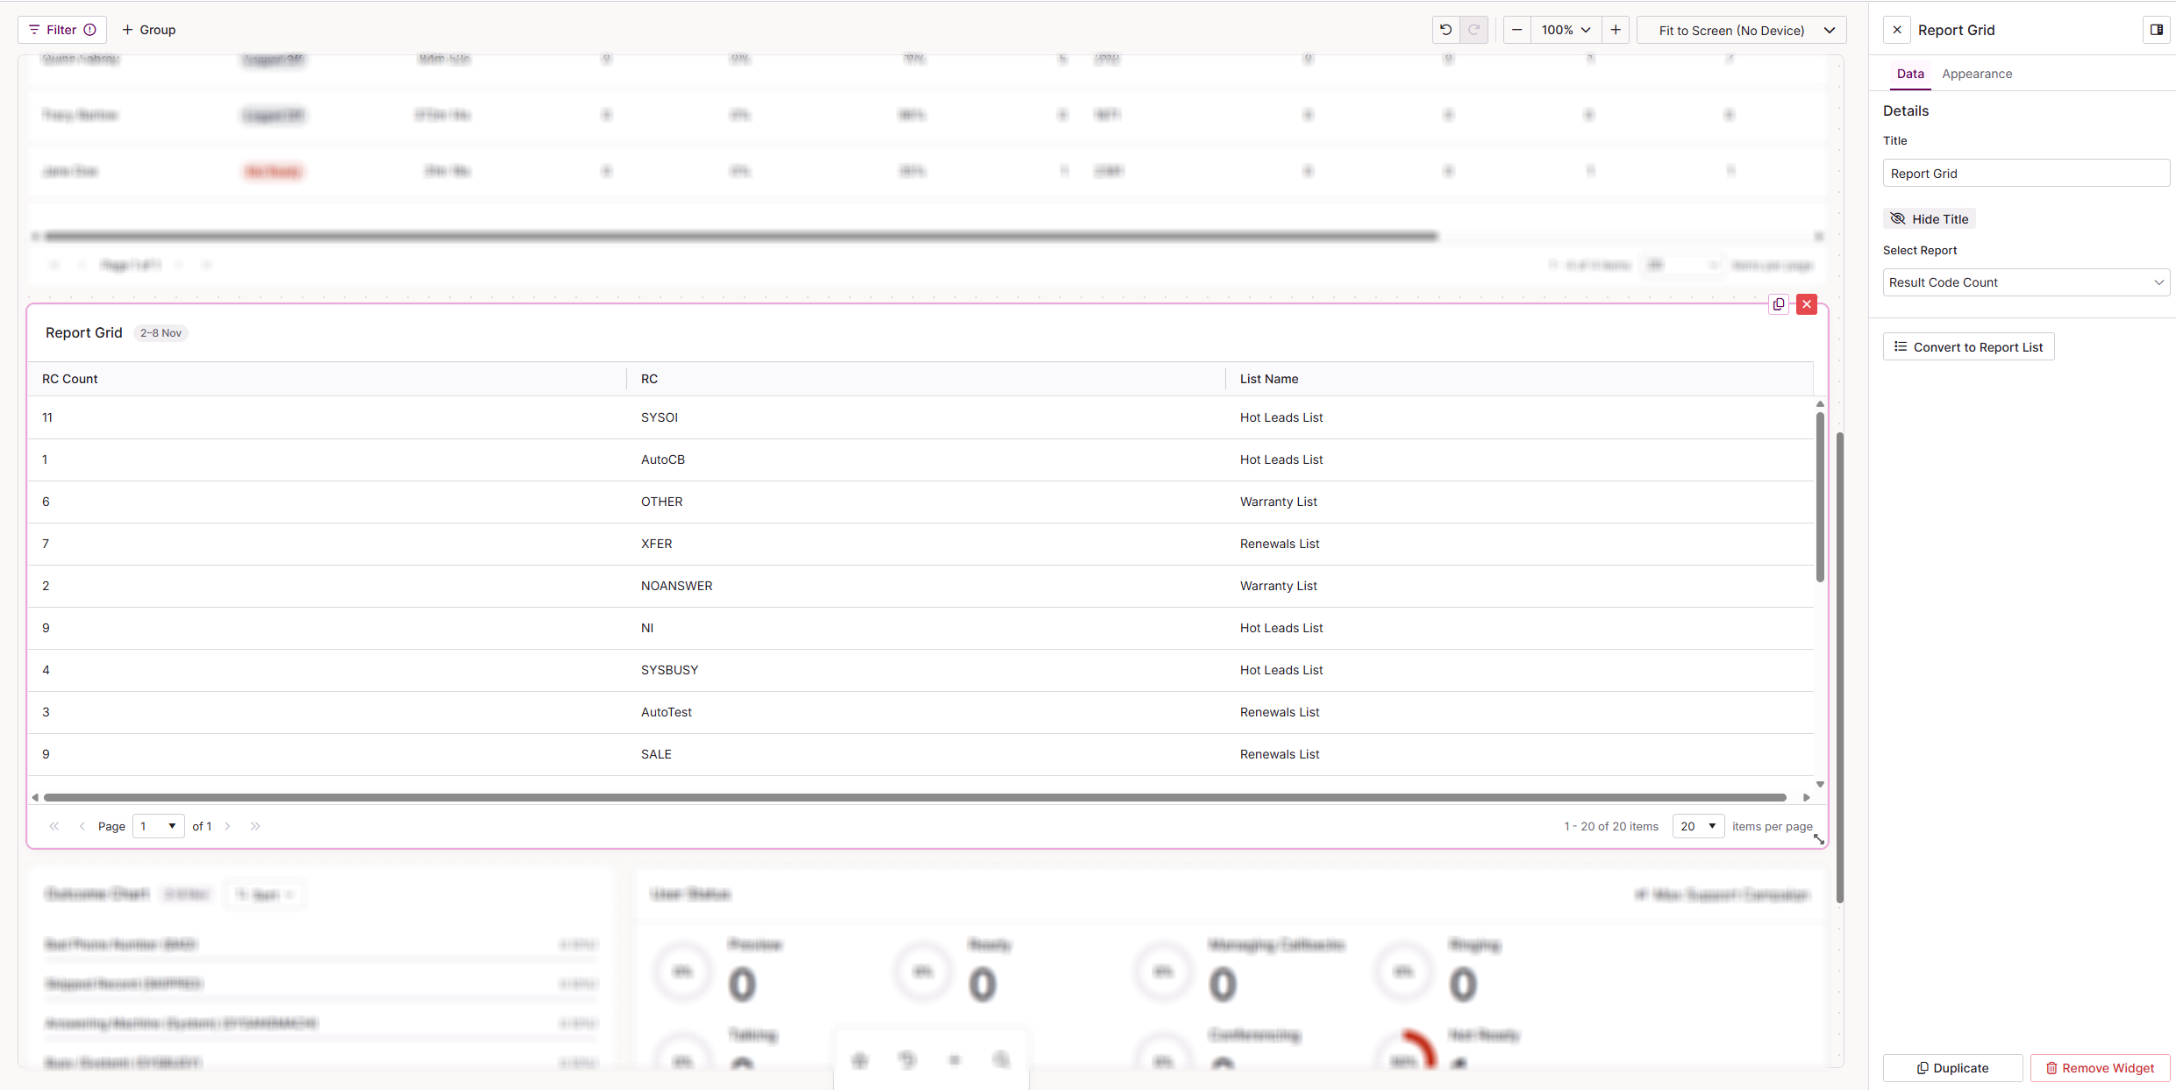
The Report Grid shows the results of a report as a paged grid.
| Setting | Description |
|---|---|
| Title | The name shown at the top of the widget on your dashboard. Select Hide Title to remove it from view. |
| Select Report | The report whose results the grid displays. Choose from the system reports in the list. |
| Convert to Report List | Switches the widget to a Report List, keeping your settings. |
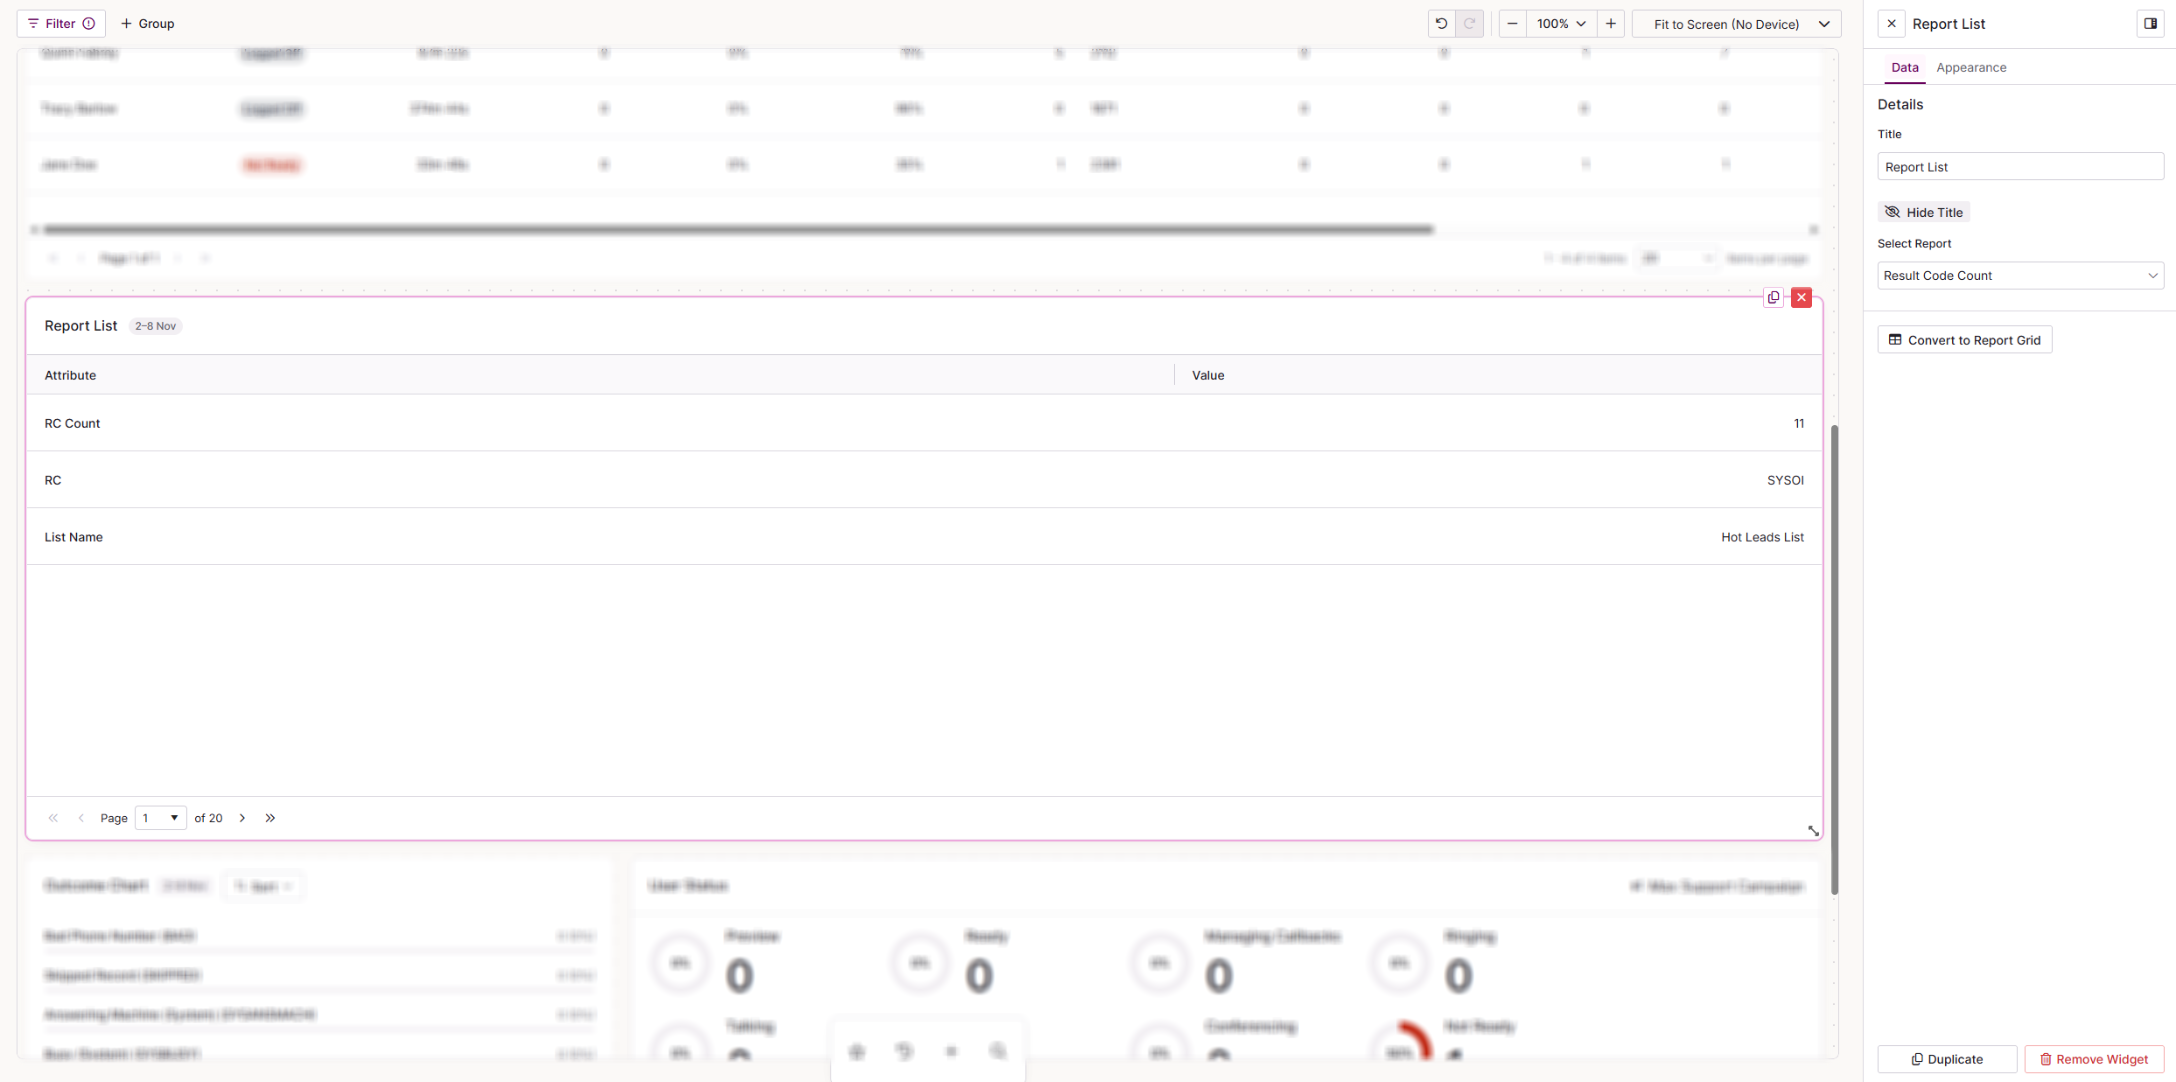
The Report List shows the results of a report one row at a time, as label and value pairs.
| Setting | Description |
|---|---|
| Title | The name shown at the top of the widget on your dashboard. Select Hide Title to remove it from view. |
| Select Report | The report whose results the list displays. Choose from the system reports in the list. |
| Convert to Report Grid | Switches the widget to a Report Grid, keeping your settings. |
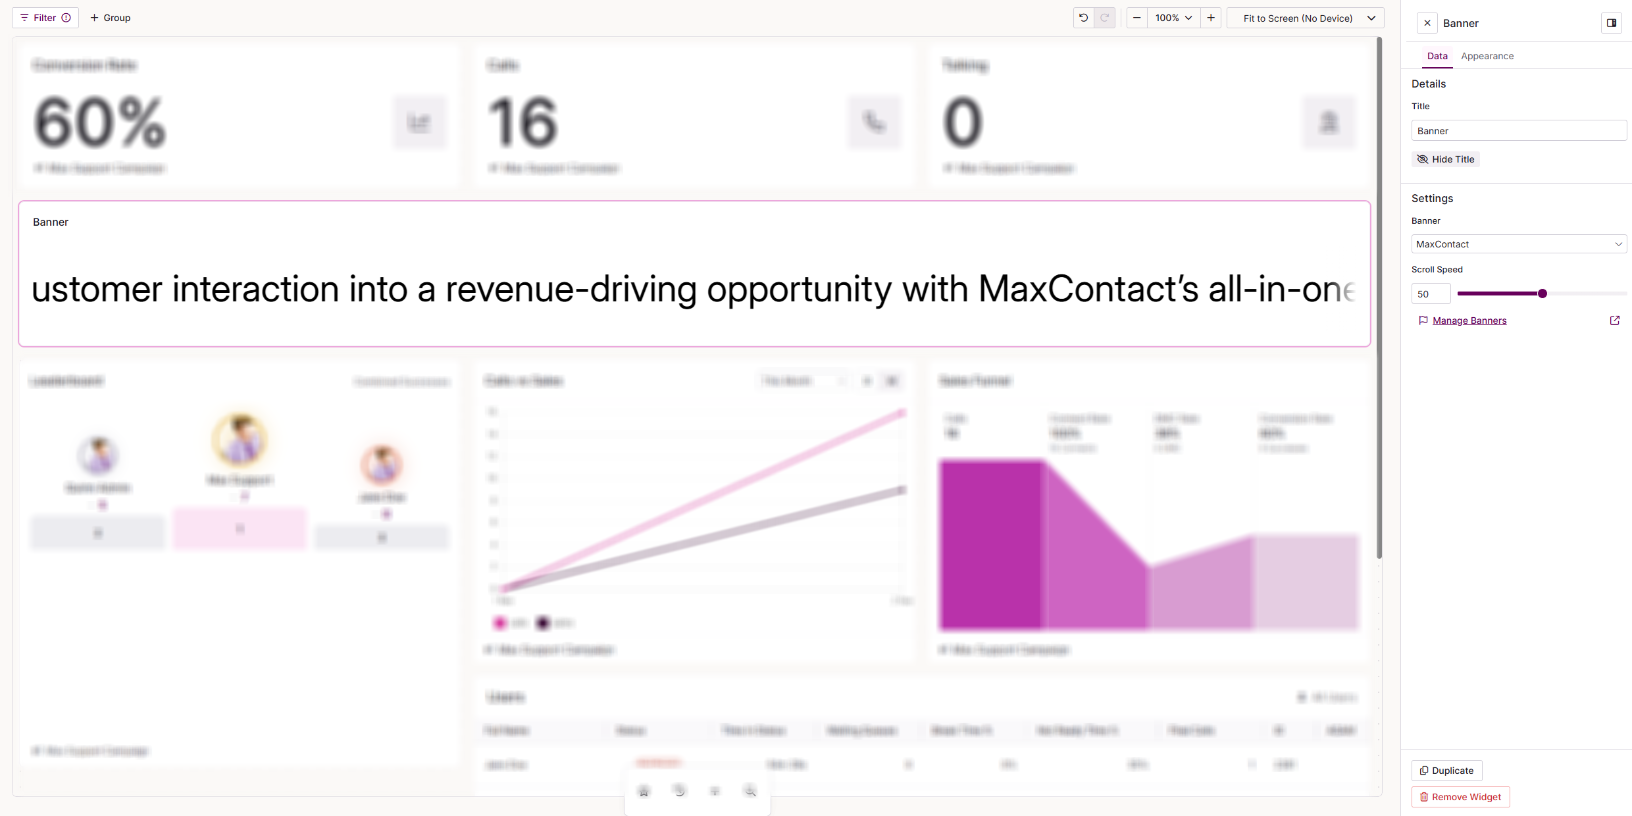
The Banner displays a scrolling or static message on your dashboard. You create and edit the message on the Banners page, so any update there appears on your dashboard without editing the widget.
| Setting | Description |
|---|---|
| Widget Title | The name shown at the top of the widget on your dashboard. |
| Banner | The banner message to display. |
| Scroll Speed | How quickly the message scrolls across the widget. |
| Manage banners | Opens the Banners page so you can create or edit banner messages. |
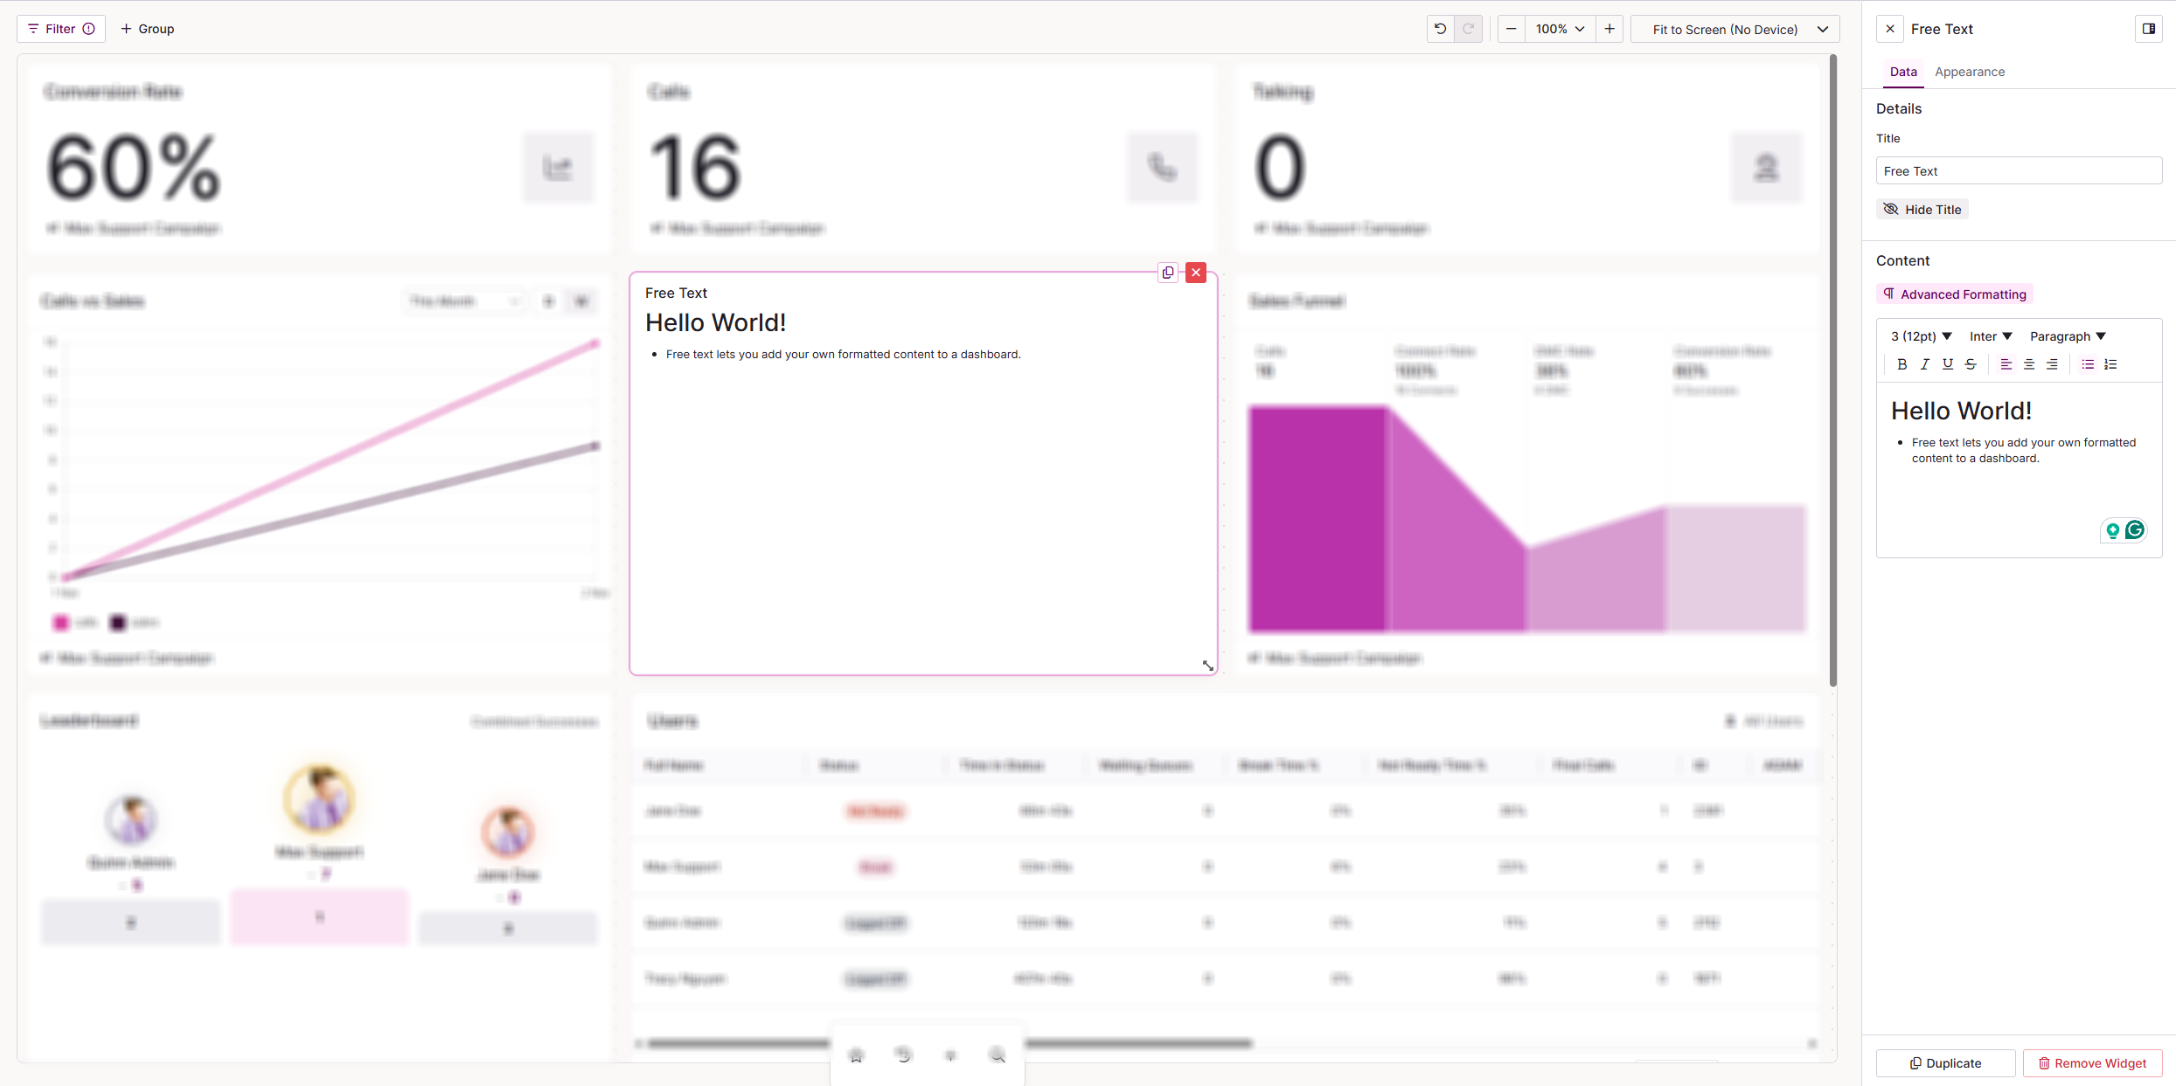
Free Text lets you add your own formatted content to a dashboard, such as labels, instructions or simple tables. Use the editor to write and style your text.
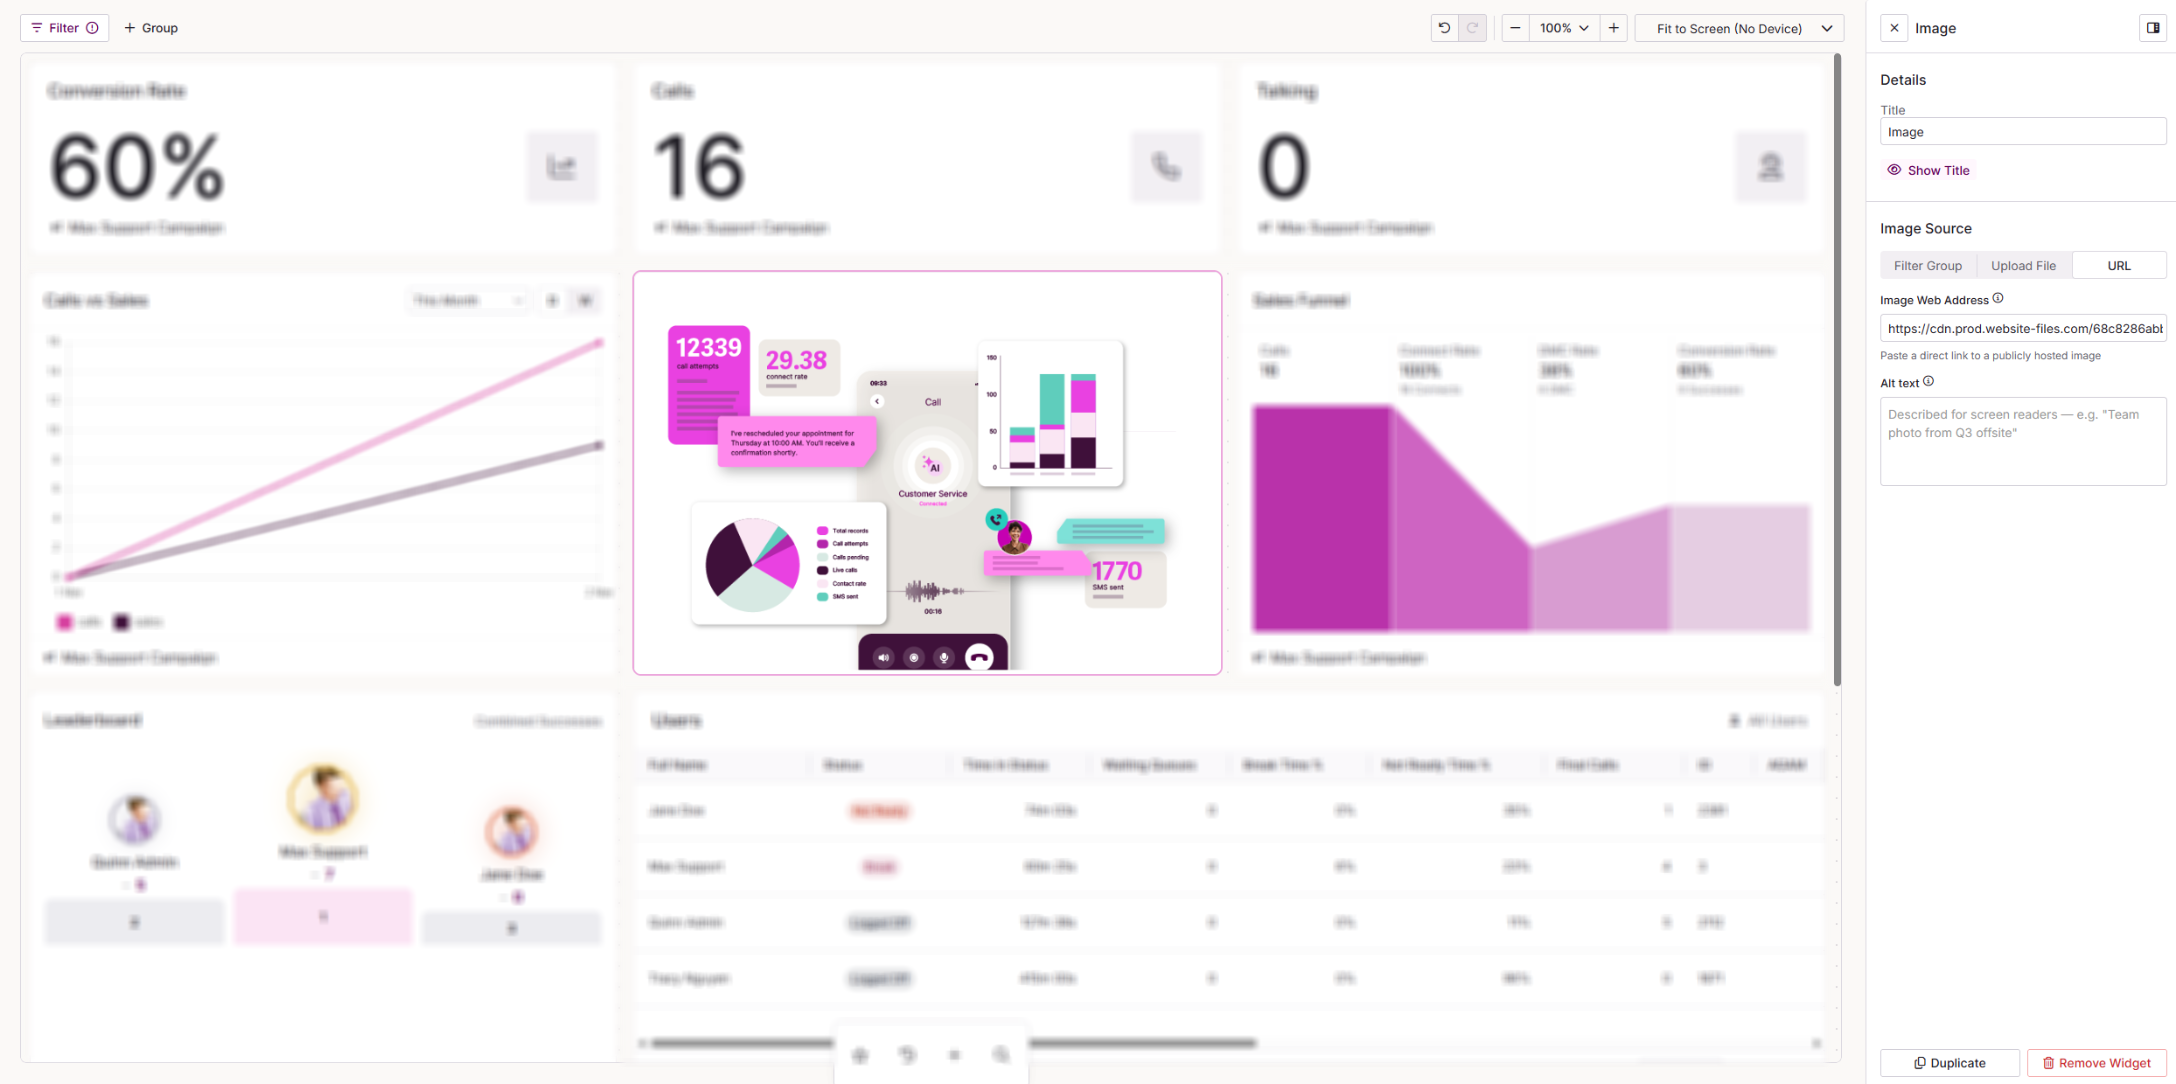
The Image widget displays a picture on your dashboard. It can show a fixed image, or one that changes based on your dashboard filters.
| Setting | Description |
|---|---|
| Title | The name shown at the top of the widget on your dashboard. Select Hide Title to remove it from view. |
| Image Source | Choose where the image comes from: Filters, Upload File or URL. |
| Filter Group | Shows the image associated with the selected User, Campaign, List or Team. Set this image on the relevant CTU record. |
| Upload File | Upload an image from your device. Supported formats are .jpg, .jpeg and .png. |
| URL | Paste a direct link to a publicly hosted image. |
| Alt Text | Only visible when Image Source is set to URL. A short description of the image for screen readers and accessibility tools. |
Template widgets
Template widgets are base widgets with settings already applied. Each one is a quick starting point for a common view, and you can adjust its settings once it is on your dashboard.
 Queue
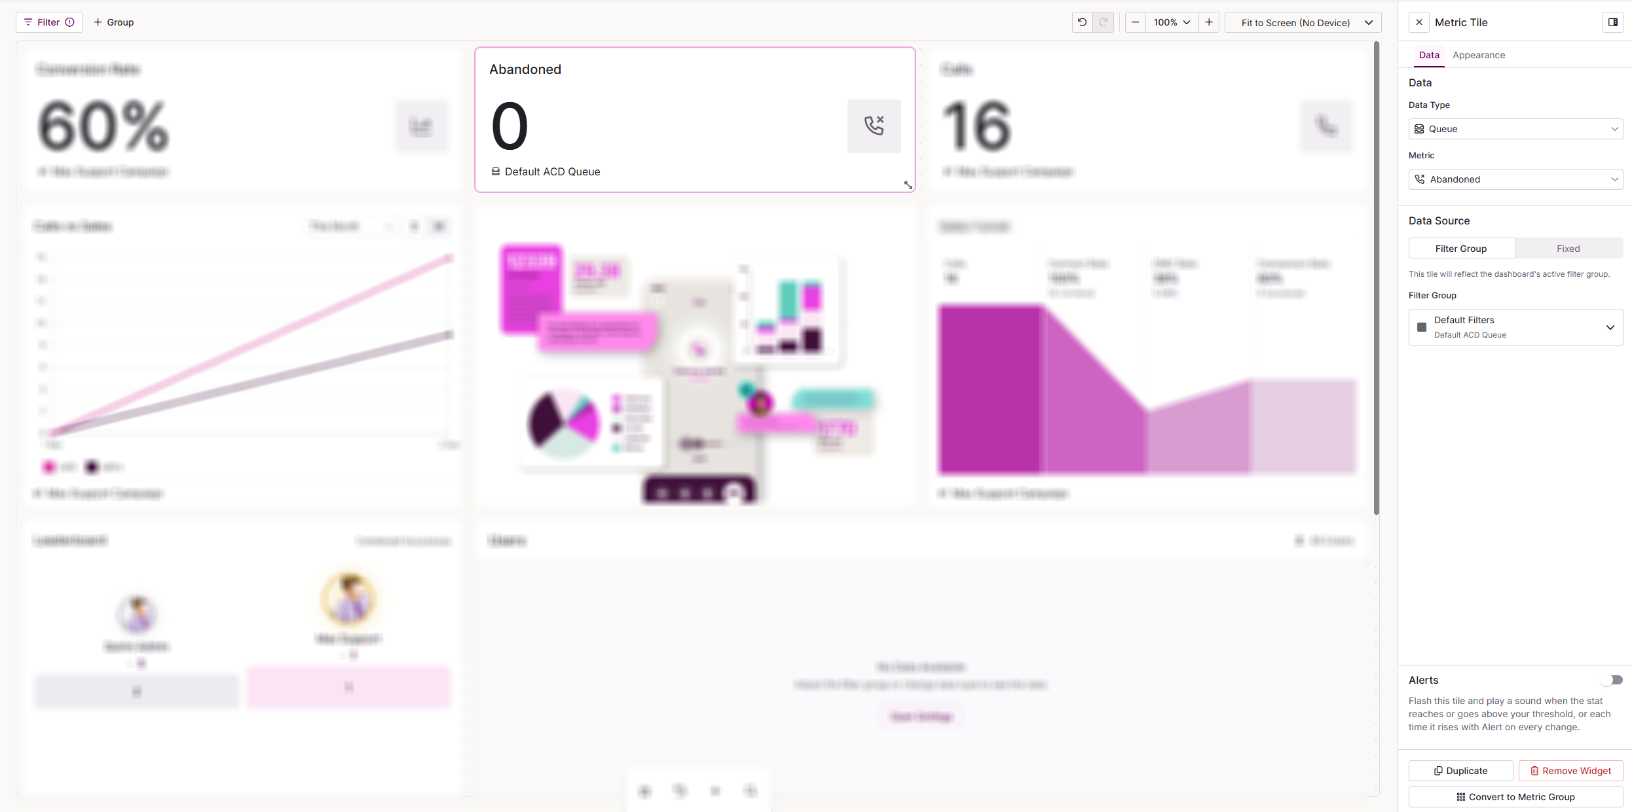
Queue is a Metric Tile set up to show real-time statistics for a queue.
| Setting | Description |
|---|---|
| Data Type | The data the metric is based on. For this tile, it is automatically set to Queue. |
| Metric | The metric the tile displays. |
| Source | Select Filter to use one of the filters set up on your dashboard, or Fixed to set a specific queue on the widget. |
| Alerts | Switch on to make the widget flash and play a sound when the stat reaches your threshold. You can also set it to alert each time the stat rises. Threshold: With a threshold set, the alert fires each time the stat rises while it's at or above the threshold, not only when it first reaches it. With no threshold set, the alert fires each time the stat rises. Alert on every change: With a threshold set, the alert fires each time the stat rises while it's at or above the threshold, not only when it first reaches it. With no threshold set, the alert fires each time the stat rises. Force focus user's notification: Brings the alert to the user's attention when it fires. Each user needs the Force Focus extension installed in Chrome for this to work. Sound: The sound played when the alert fires. Choose a sound that's already been uploaded, or upload your own .wav file of up to 2MB. Select File: Choose the sounds already uploaded to your system. Upload .wav file: Switch to this tab to upload a new .wav file for this widget. |
| Convert to Metric Group | Switches the widget to a Metric Group so you can show more than one metric. |
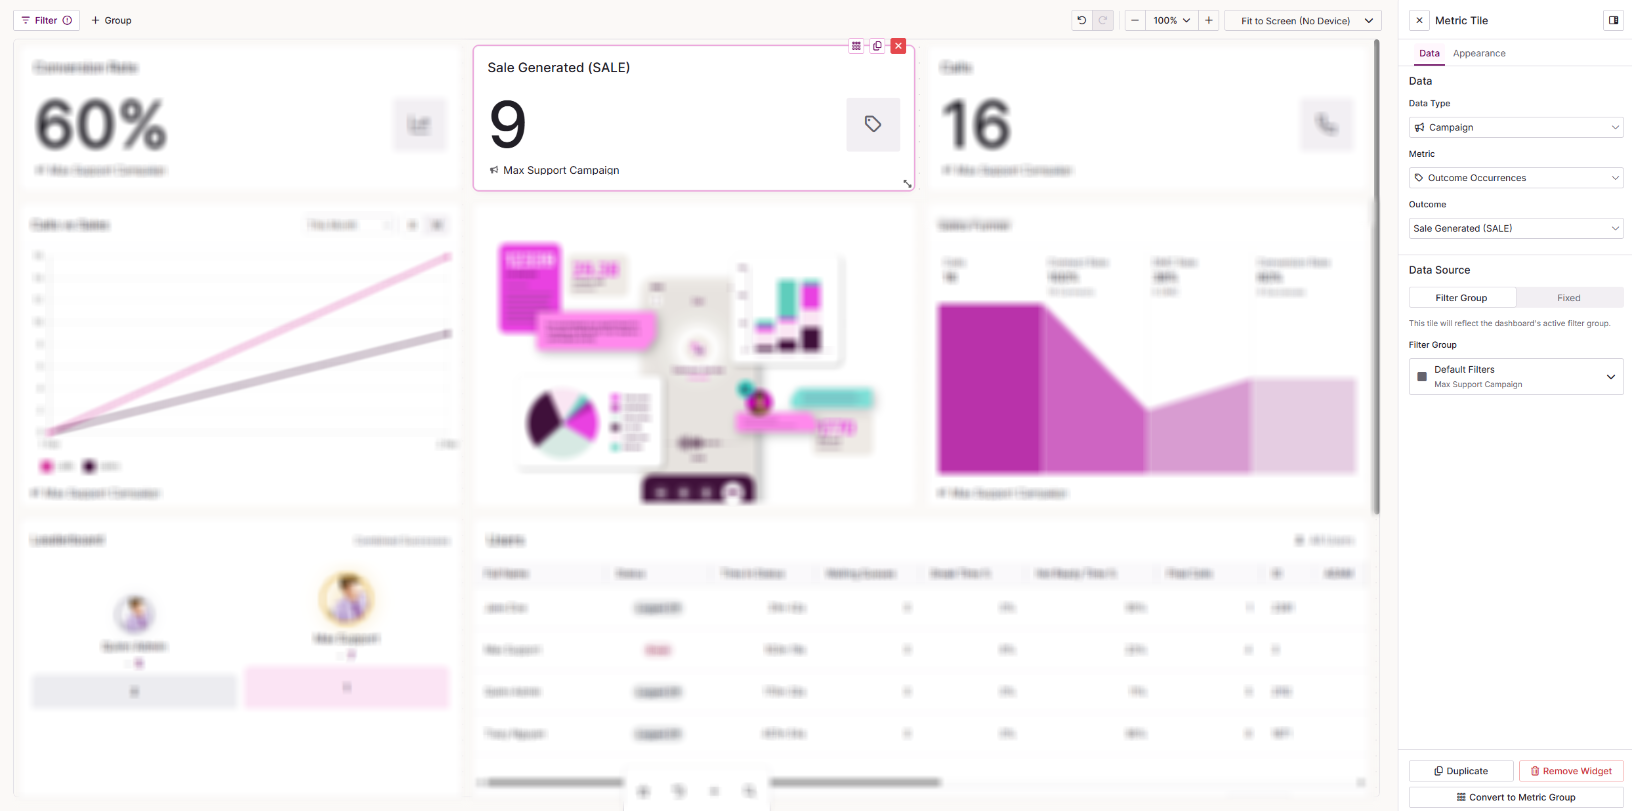
Interaction Outcome is a Metric Tile set up to count how many times a specific outcome (result code) has been used, in real time.
| Setting | Description |
|---|---|
| Data Type | The data the count is based on. Choose from User, Campaign, List, Team or Queue. |
| Metric | The metric the tile displays. For this tile, it is automatically set to Outcome Occurrences |
| Outcome | The outcome (resut code) the tile counts. |
| Convert to Metric Group | Switches the widget to a Metric Group so you can show more than one metric. |
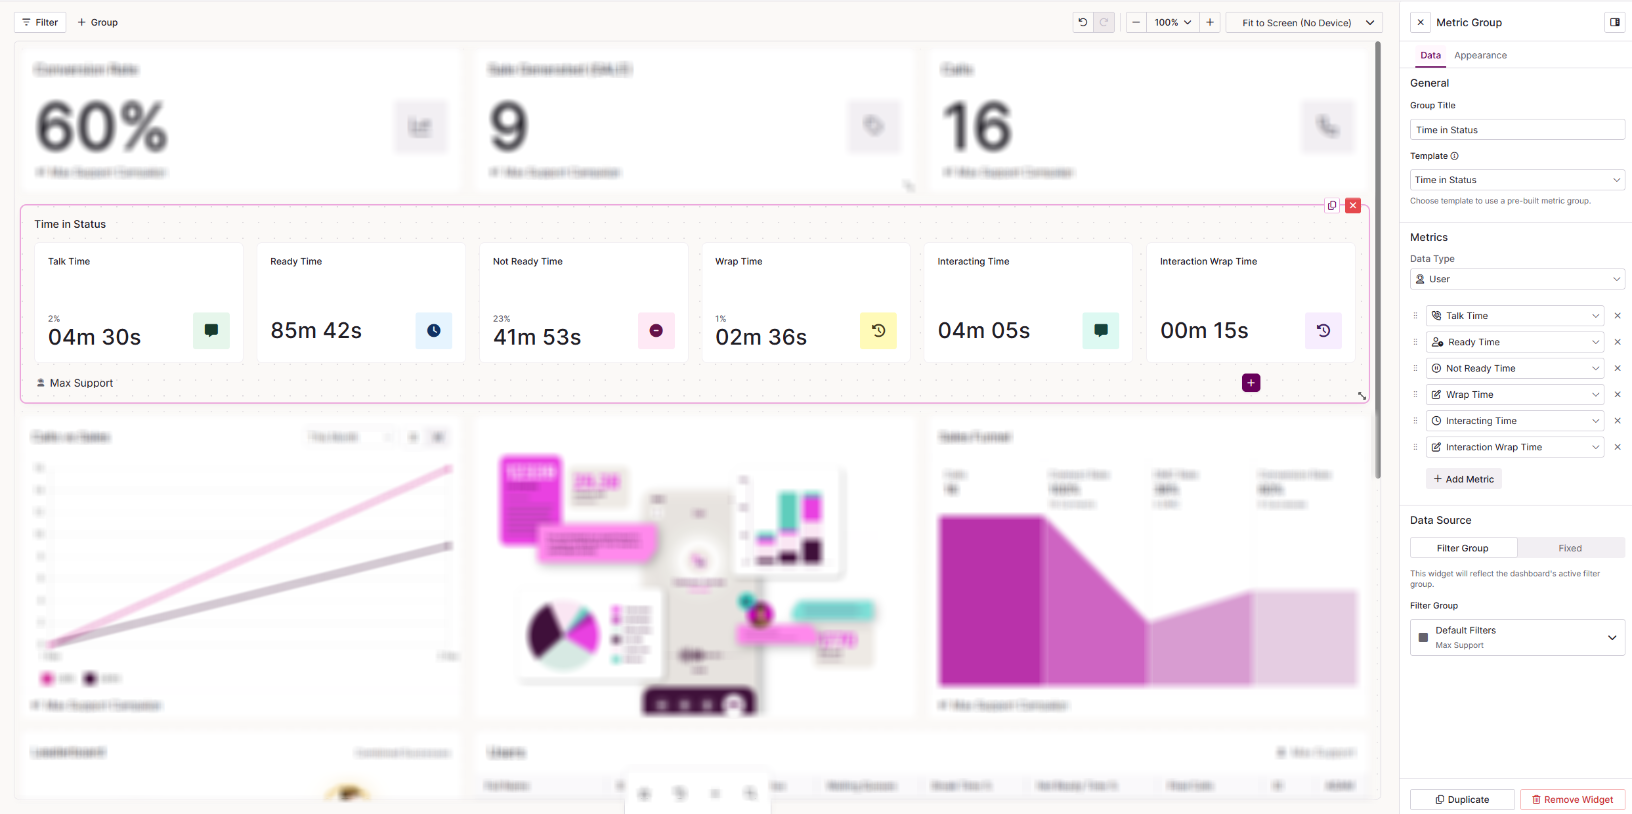
Time in Status is a Metric Group set up to show the percentage of time agents spend in each status.
| Setting | Description |
|---|---|
| Group Title | The name of the widget as shown on your dashboard. |
| Template | For this tile, it is automatically set to Time in Status. |
| Data Type | The data the metrics are based on. Choose from User, Campaign, List, Team or Queue. |
| Metrics | Select Add Metric to add a metric to the group. Drag metrics to reorder them, or remove any you do not want to display. |
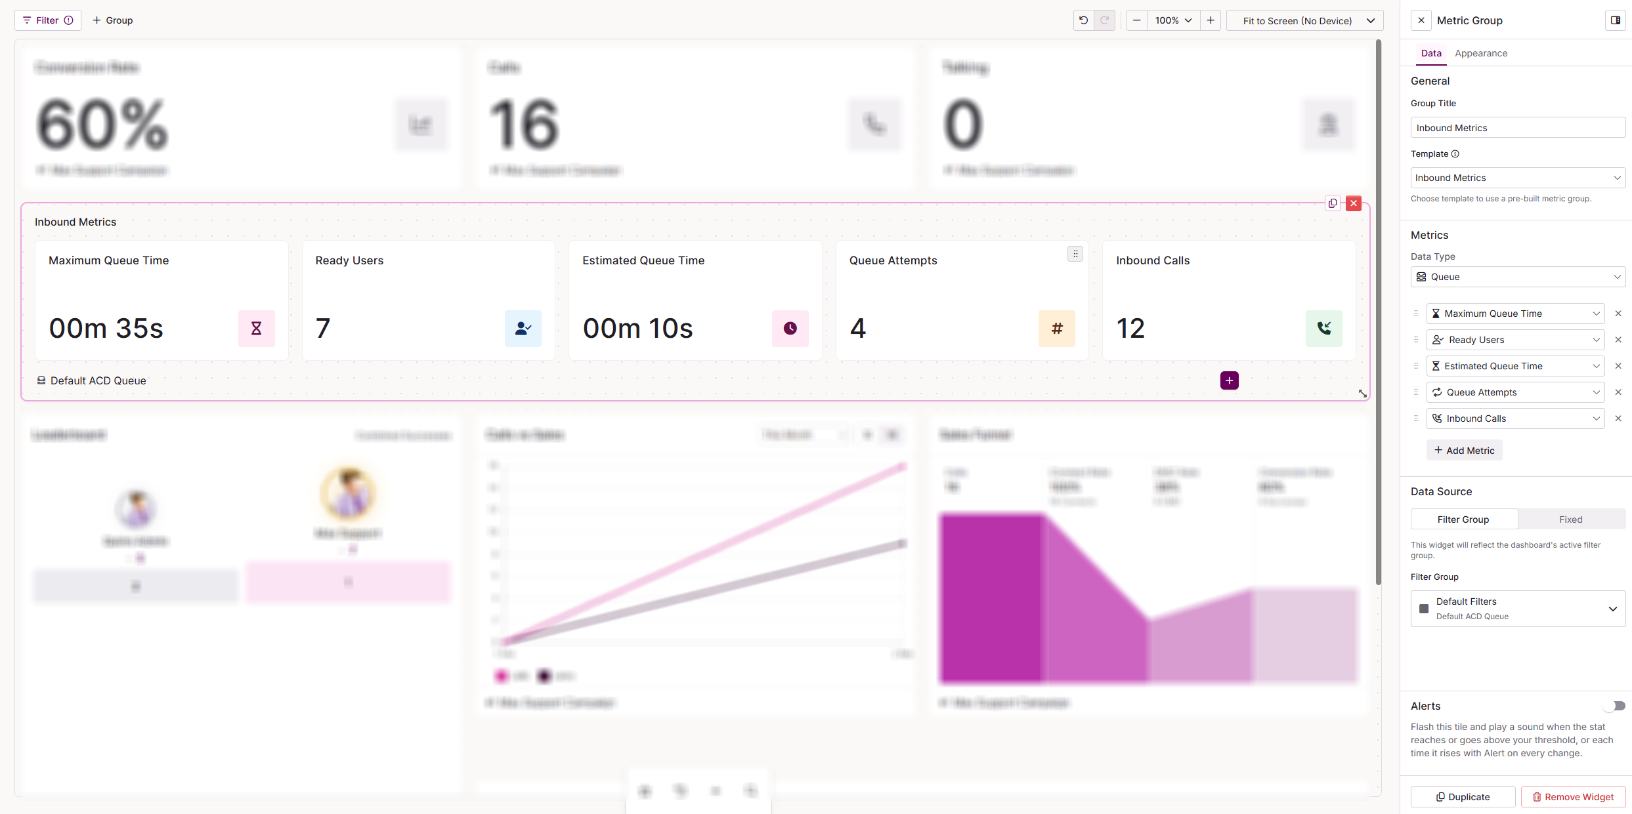 Inbound Metrics
 is a Metric Group set up to show inbound call queue statistics.
| Setting | Description |
|---|---|
| Group Title | The name of the widget as shown on your dashboard. |
| Template | For this tile, it is automatically set to Inbound Metrics. |
| Data Type | The data the metrics are based on. Choose from User, Campaign, List, Team or Queue. |
| Metrics | Select Add Metric to add a metric to the group. Drag metrics to reorder them, or remove any you do not want to display. |
| Alerts | Switch on to make the widget flash and play a sound when a particular stat reaches your threshold. You can also set it to alert each time that stat rises. Metric to alert for: Select which metric within the group to alert for. Threshold: With a threshold set, the alert fires each time the stat rises while it's at or above the threshold, not only when it first reaches it. With no threshold set, the alert fires each time the stat rises. Alert on every change: With a threshold set, the alert fires each time the stat rises while it's at or above the threshold, not only when it first reaches it. With no threshold set, the alert fires each time the stat rises. Force focus user's notification: Brings the alert to the user's attention when it fires. Each user needs the Force Focus extension installed in Chrome for this to work. Sound: The sound played when the alert fires. Choose a sound that's already been uploaded, or upload your own .wav file of up to 2MB. Select File: Choose the sounds already uploaded to your system. Upload .wav file: Switch to this tab to upload a new .wav file for this widget. |
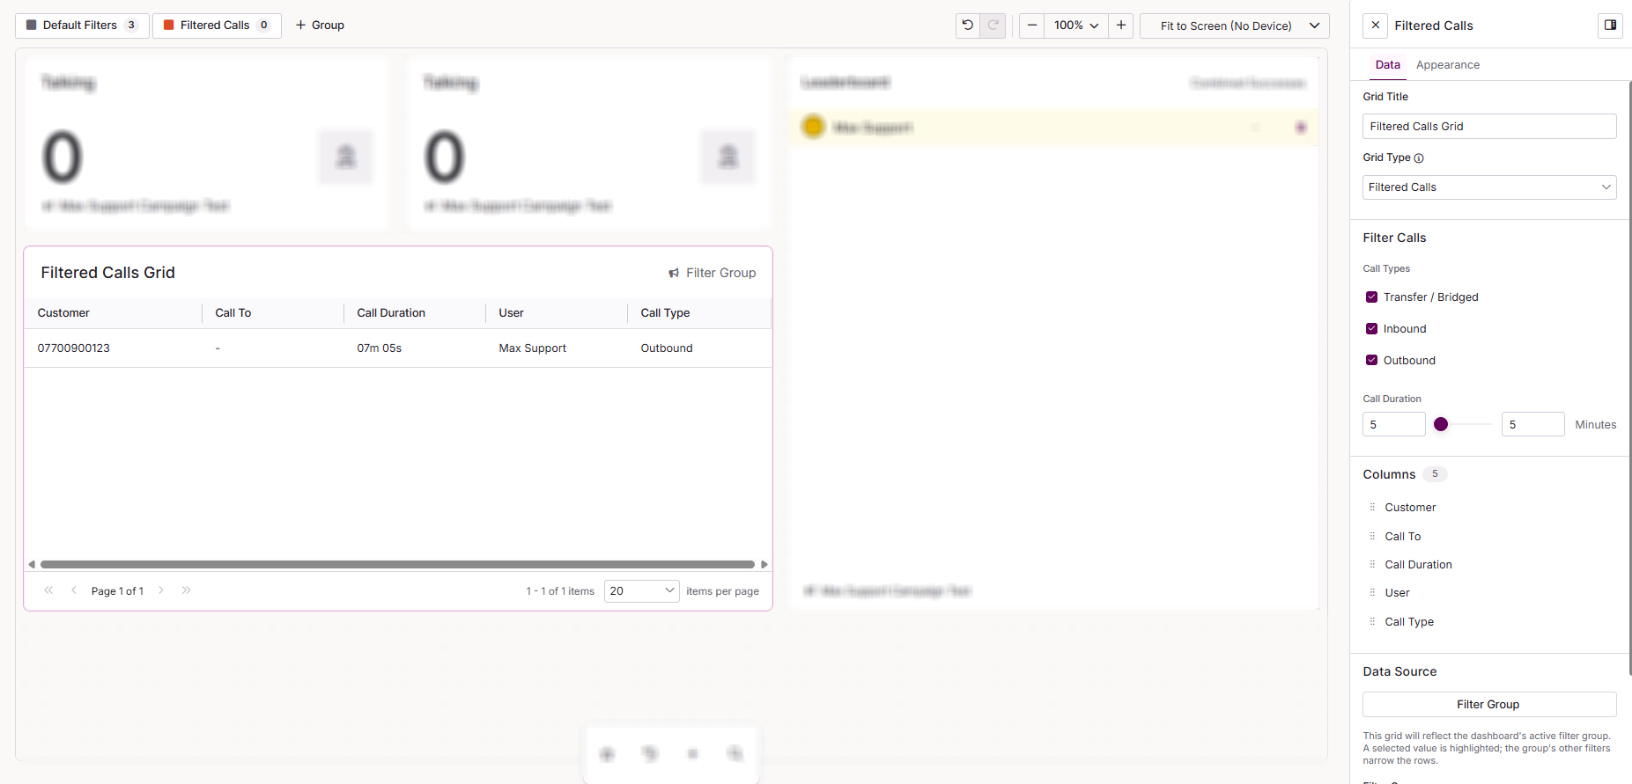
Filtered Calls is a Configurable Grid that lists live calls matching the call types and duration you set. Use it to spot calls running longer than expected.
| Setting | Description |
|---|---|
| Grid Title | The name shown at the top of the grid on your dashboard. |
| Grid Type | For this tile, it is automatically set to Filtered Calls. |
| Call Types | Tick the call types to include: Transfer/Bridged, Inbound and Outbound. |
| Call Duration | Use the slider to set the minimum and maximum call length shown, from 0 to 60 minutes. |
| Columns | Drag to reorder the columns: Customer, Call To, Call Duration, User and Call Type. |
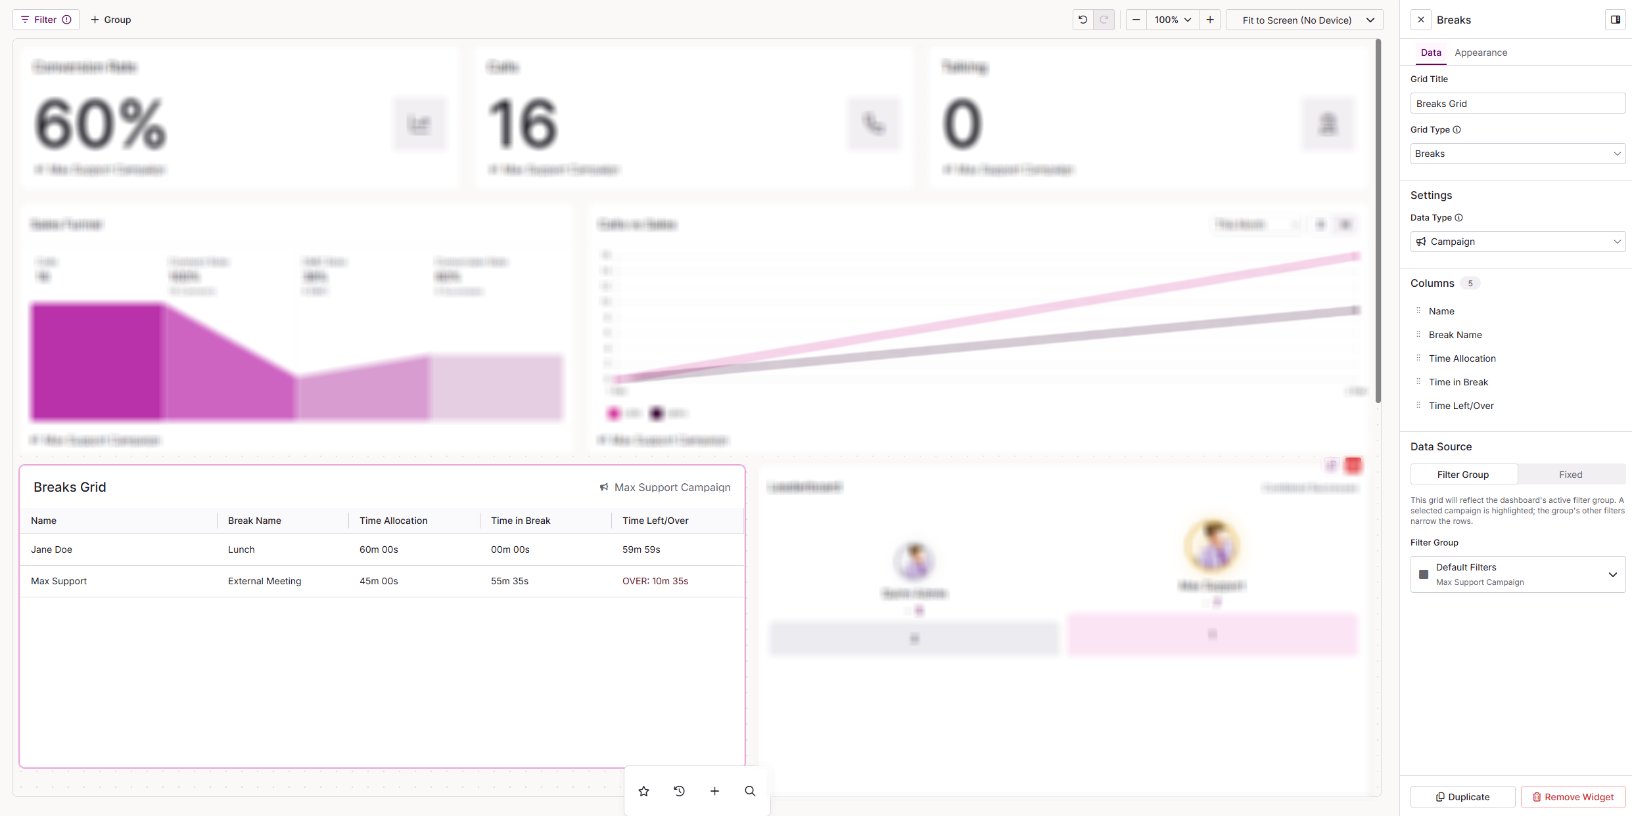
Breaks is a Configurable Grid that shows which users are on break, how long they are allowed and how much time they have left.
| Setting | Description |
|---|---|
| Grid Title | The name shown at the top of the grid on your dashboard. |
| Grid Type | For this tile, it is automatically set to Breaks. |
| Data Type | Choose Campaign or Team. |
| Columns | Drag to reorder the columns: Name, Break Name, Time Allocation, Time in Break and Time Left/Over. |
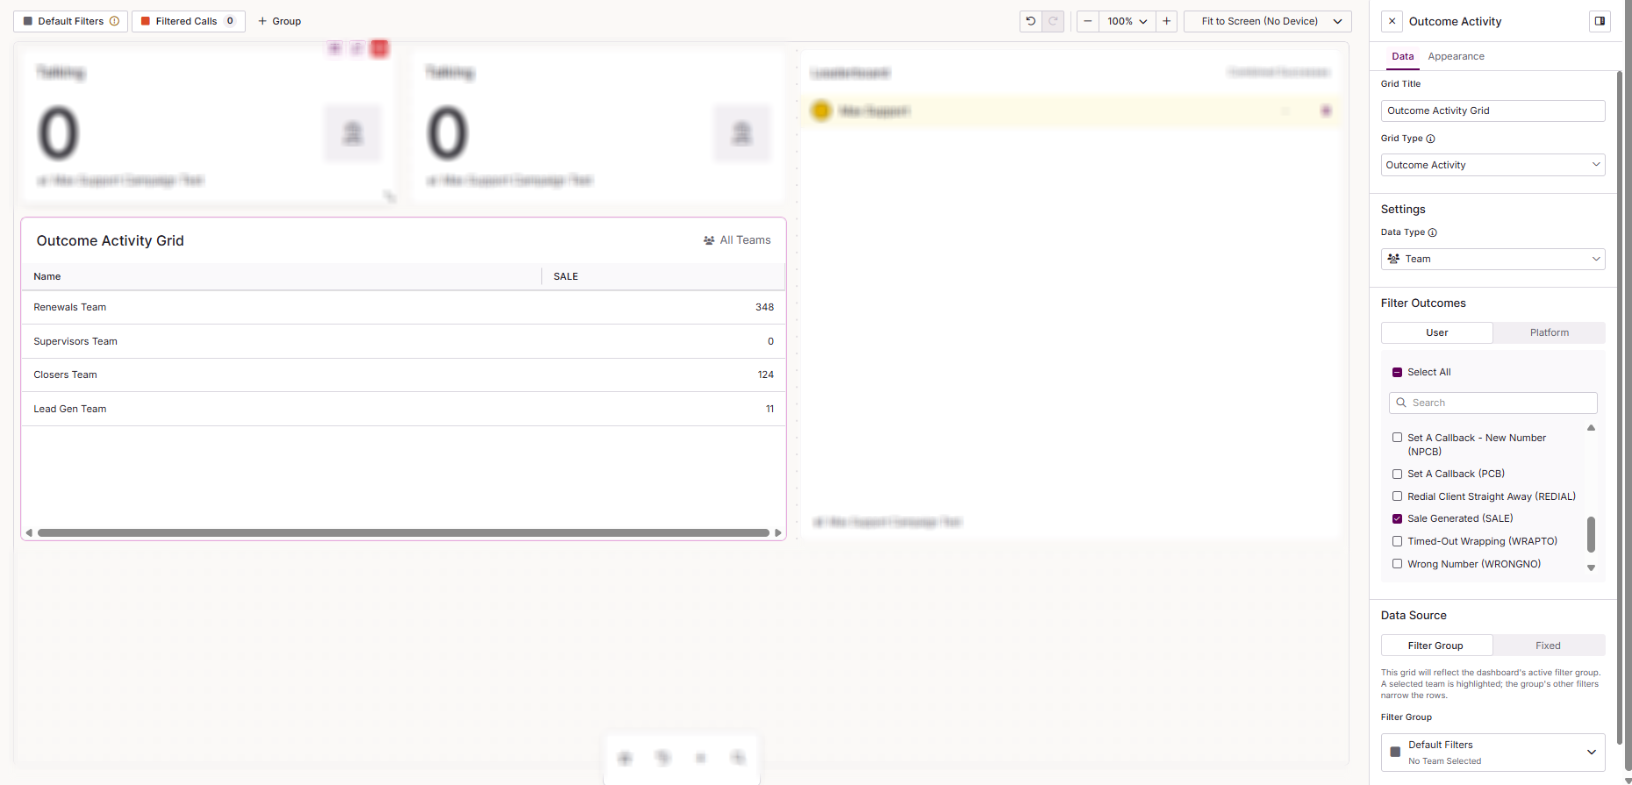
Outcome Activity
Outcome Activity is a Configurable Grid that shows how many times each outcome (result code) has been used, per campaign, team, user or list.
| Setting | Description |
|---|---|
| Grid Title | The name shown at the top of the grid on your dashboard. |
| Grid Type | For this tile, it is automatically set to Outcome Activity. |
| Data Type | Choose from User, Campaign, Team or List. |
| Filter Outcomes | Choose which outcomes to include. The User tab lists your active user outcomes. The System tab lists the active system outcomes (system result codes). Tick or untick each outcome, or use the search to find one. |
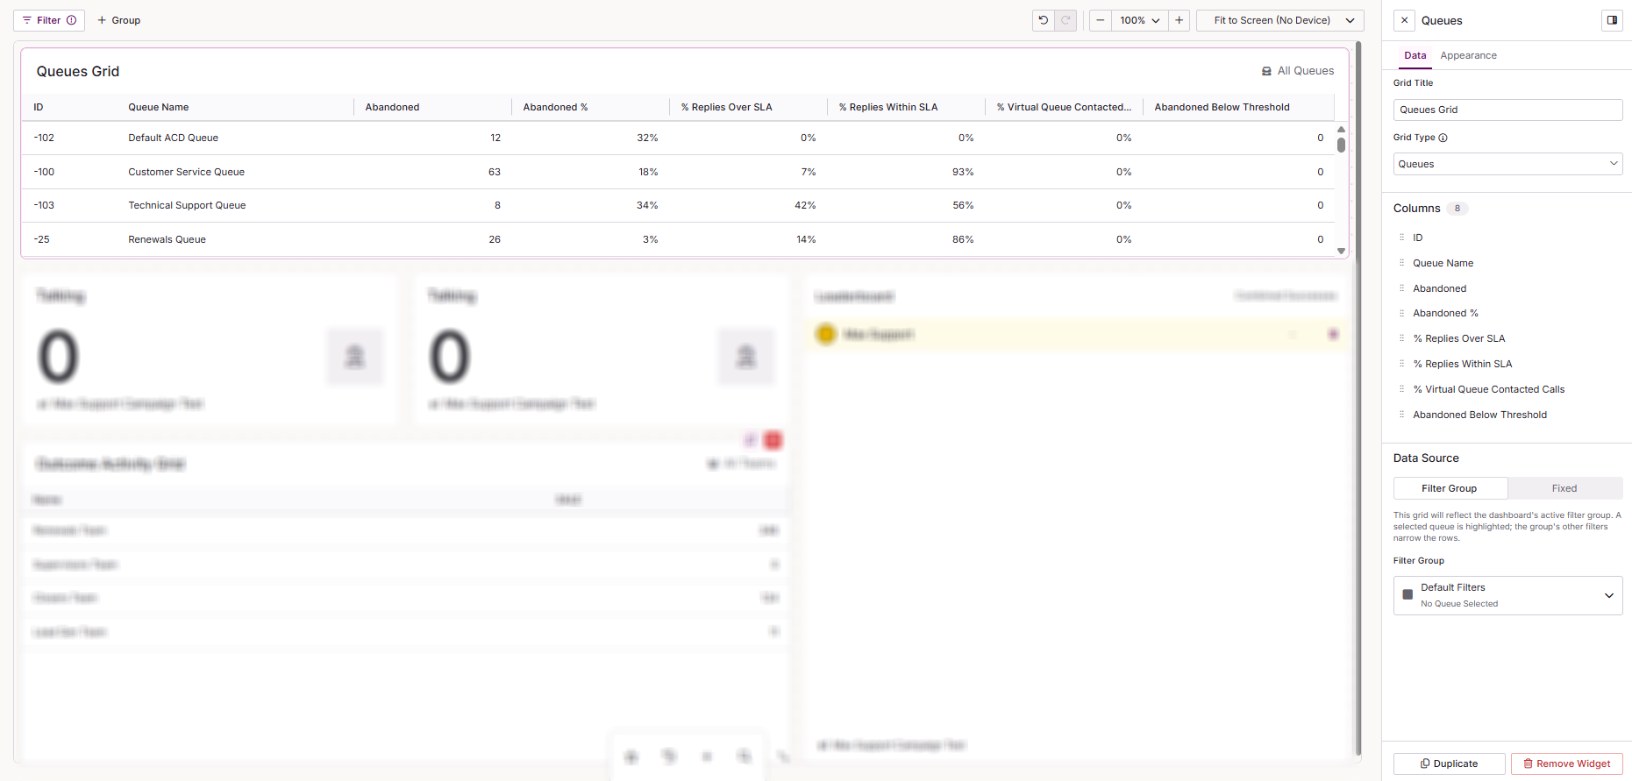
Queues
Queues is a Configurable Grid that shows your interaction queues alongside SLA and abandonment metrics.
| Setting | Description |
|---|---|
| Grid Title | The name shown at the top of the grid on your dashboard. |
| Grid Type | For this tile, it is automatically set to Queues. |
| Columns | Drag to reorder the columns: ID, Name, % Replies Over SLA, % Replies Within SLA, % VQ Contacted Calls, Abandoned, Abandoned % and Abandoned Below Threshold. |
Widget appearance
Your dashboard theme sets the default styling for every widget. To give a single widget its own styling, select it and open the Appearance tab. Any changes you make there override the dashboard theme for that widget only. See Dashboard Studio: Overview for details on dashboard themes.
Widgets with the same appearance settings are grouped together below.
Metric Tile, Queue, Interaction Outcome and Time in Status
| Setting | Description |
|---|---|
| Alignment | Where the data sits within the tile. Choose Left or Centred. |
| Icon | Choose Show Icon to display an icon in the tile, or No Icon to remove it. |
| Title Size | The size of the widget title. Scales automatically with the widget. |
| Font Size | The size of the metric value. Scales automatically with the widget. |
| Widget Colour | Overrides the dashboard colour for this widget. Choose from 22 preset colours, or enter a custom hex colour. On a Metric Group, Time in Status or Inbound Metrics widget, you can set a different colour for each tile in the group. |
| Colour Application | How the widget colour is applied. Choose Icon to colour only the icon, Subtle to fill the widget with a lighter shade of the colour, or Solid to fill the widget with the full colour. Individual widgets may override this setting. |
| Conditional Colours | Colours the whole tile when its value meets a rule. The first matching rule from the top wins. With no match, the tile keeps its own colour. |
Metric Group and Inbound Metrics
| Setting | Description |
|---|---|
| Alignment | Where the data sits within the tile. Choose Left or Centred. |
| Icon | Choose Show Icon to display an icon in the tile, or No Icon to remove it. |
| Title Size | The size of the widget title. Scales automatically with the widget. |
| Font Size | The size of the metric value. Scales automatically with the widget. |
| Widget Colour | Overrides the dashboard colour for this widget. Choose from 22 preset colours, or enter a custom hex colour. On a Metric Group, Time in Status or Inbound Metrics widget, you can set a different colour for each tile in the group. |
| Colour Application | How the widget colour is applied. Choose Icon to colour only the icon, Subtle to fill the widget with a lighter shade of the colour, or Solid to fill the widget with the full colour. Individual widgets may override this setting. |
| Individual Tile | Allows you to set a colour for an individual tile within the group. |
CTU List
| Setting | Description |
|---|---|
| Layout | Choose Large Image to show a larger image alongside each card, or Compact for a smaller image and a tighter layout. |
| Display | Show or hide the image on each card. |
| Metrics | Show or hide the metrics on each card. |
User Info, Configurable Grid, Outcome List, Report Grid, Report List, Filtered Calls, Breaks, Outcome Activity and Queues
| Setting | Description |
|---|---|
| Grid Density | The height of each row, which controls how many rows fit in the widget. Choose Compact, Standard or Roomy. |
| Title Font Size | The size of the widget title. Scales automatically with the widget. |
| Grid Font Size | The size of the values in the grid. Scales automatically with the widget. |
Leaderboard
| Setting | Description |
|---|---|
| Grid Density | The height of each row, which controls how many rows fit in the widget. Choose Compact, Standard or Roomy. |
| Title Font Size | The size of the widget title. Scales automatically with the widget. |
| Grid Font Size | The size of the values in the grid. Scales automatically with the widget. |
| Leaderboard options | How users are shown on the leaderboard. Choose from:
|
User Status
| Setting | Description |
|---|---|
| Title Font Size | The size of the widget title. |
| Status Size | The size of each status value. |
Outcome Chart
| Setting | Description |
|---|---|
| Title Font Size | The size of the widget title. |
| Bar Colour | Overrides the dashboard colour for the bars in this chart. Choose from 22 preset colours, or enter a custom hex colour. |
Banner
| Setting | Description |
|---|---|
| Title Font Size | The size of the widget title. |
| Font Name | The font used for the banner text. Choose from the available fonts. |
| Font Size | The size of the banner text. |
| Font Colour | The colour of the banner text. Choose from 22 preset colours, or enter a custom hex colour. |
| Background Colour | The colour behind the banner text. Choose from 22 preset colours, or enter a custom hex colour. |
Free Text
| Setting | Description |
|---|---|
| Vertical Alignment | Where your text sits within the widget. Choose Top, Middle or Bottom. |
| Widget Colour | The colour of the widget. Choose from 22 preset colours, or enter a custom hex colour. |
| Colour Application | How the widget colour is applied. Choose Subtle to fill the widget with a lighter shade of the colour, or Solid to fill it with the full colour. |