

Dashboard Studio: Filters and Filter Groups
Filters control which data your widgets show, such as a specific campaign, team or queue. Instead of setting the data on every widget one by one, you set your filters in one place and your widgets follow them. Change a filter and every widget using it updates straight away.
Filter groups take this a step further. They let you apply a different set of filters to selected widgets on the same dashboard, so you can, for example, compare two campaigns side by side.
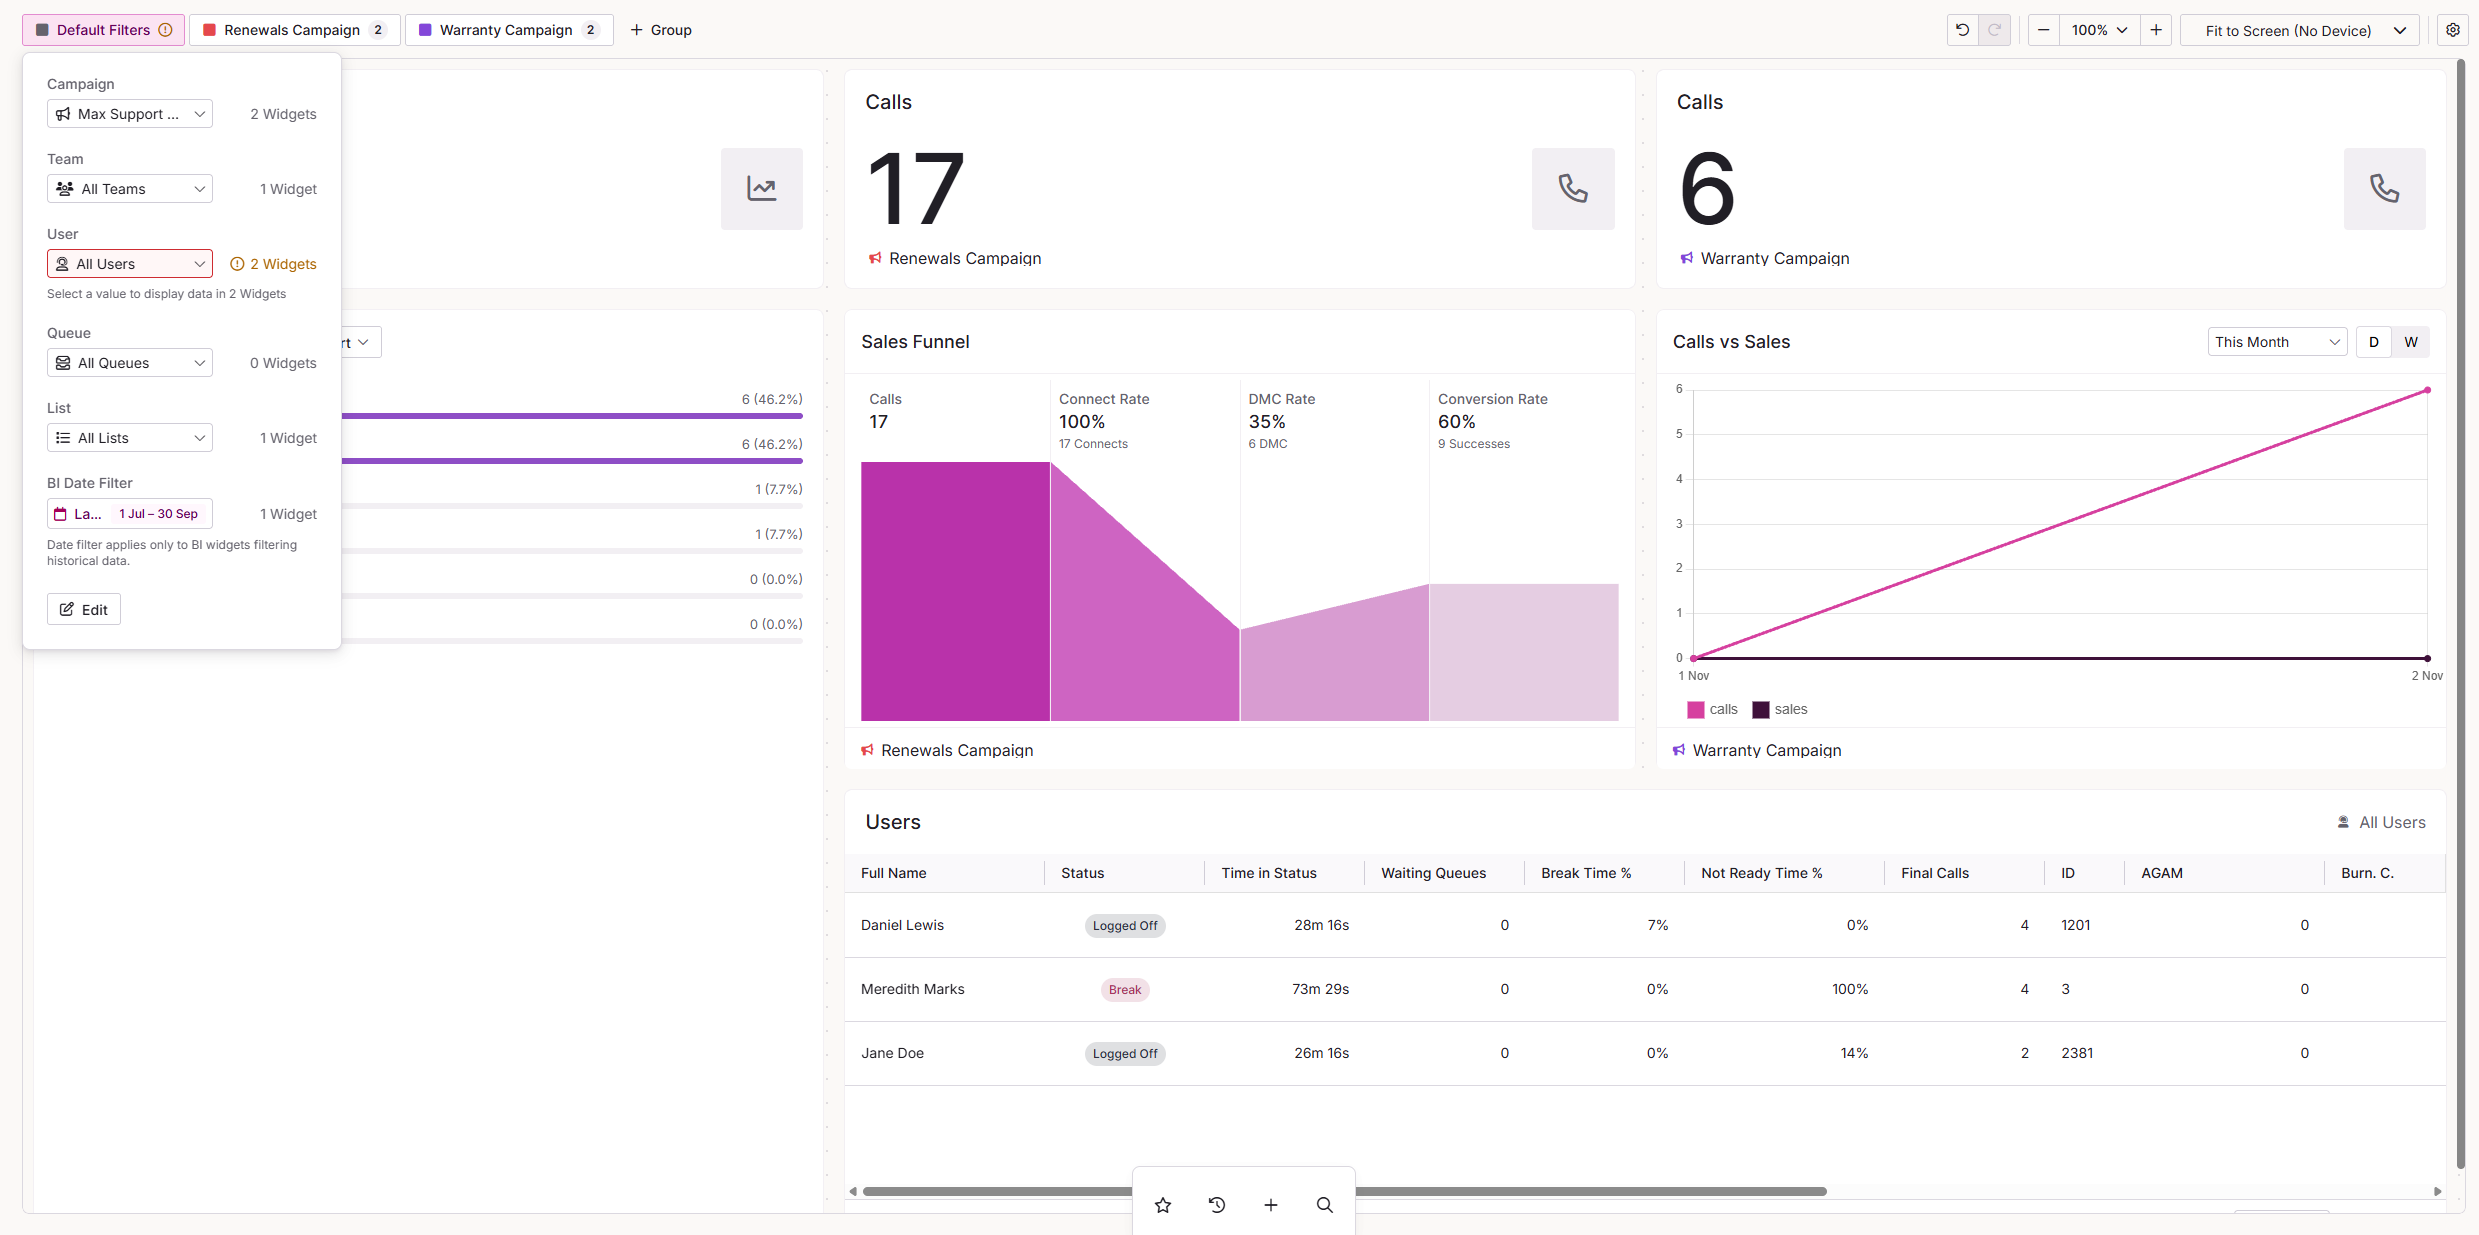
You can find the Default Filters and Filter Group options at the top left of Dashboard Studio, just above the canvas.
How widgets get their data
Every widget gets its data in one of three ways. You choose which in the Data Source setting on the widget's Data tab.
| Option | What it does | When to use it |
|---|---|---|
| Default filters | The widget follows the main filters set for the dashboard. This is the default for new widgets. | When most of your dashboard shows the same campaign, team or queue. |
| Filter group | The widget follows the filters set for a filter group instead of the main dashboard filters. | When some widgets need to show different data from the rest, such as a second campaign. |
| Fixed | The widget always shows the data you set on the widget itself and ignores all filters. | When a widget must never change, such as a tile that always shows one specific campaign. |
Filter data types
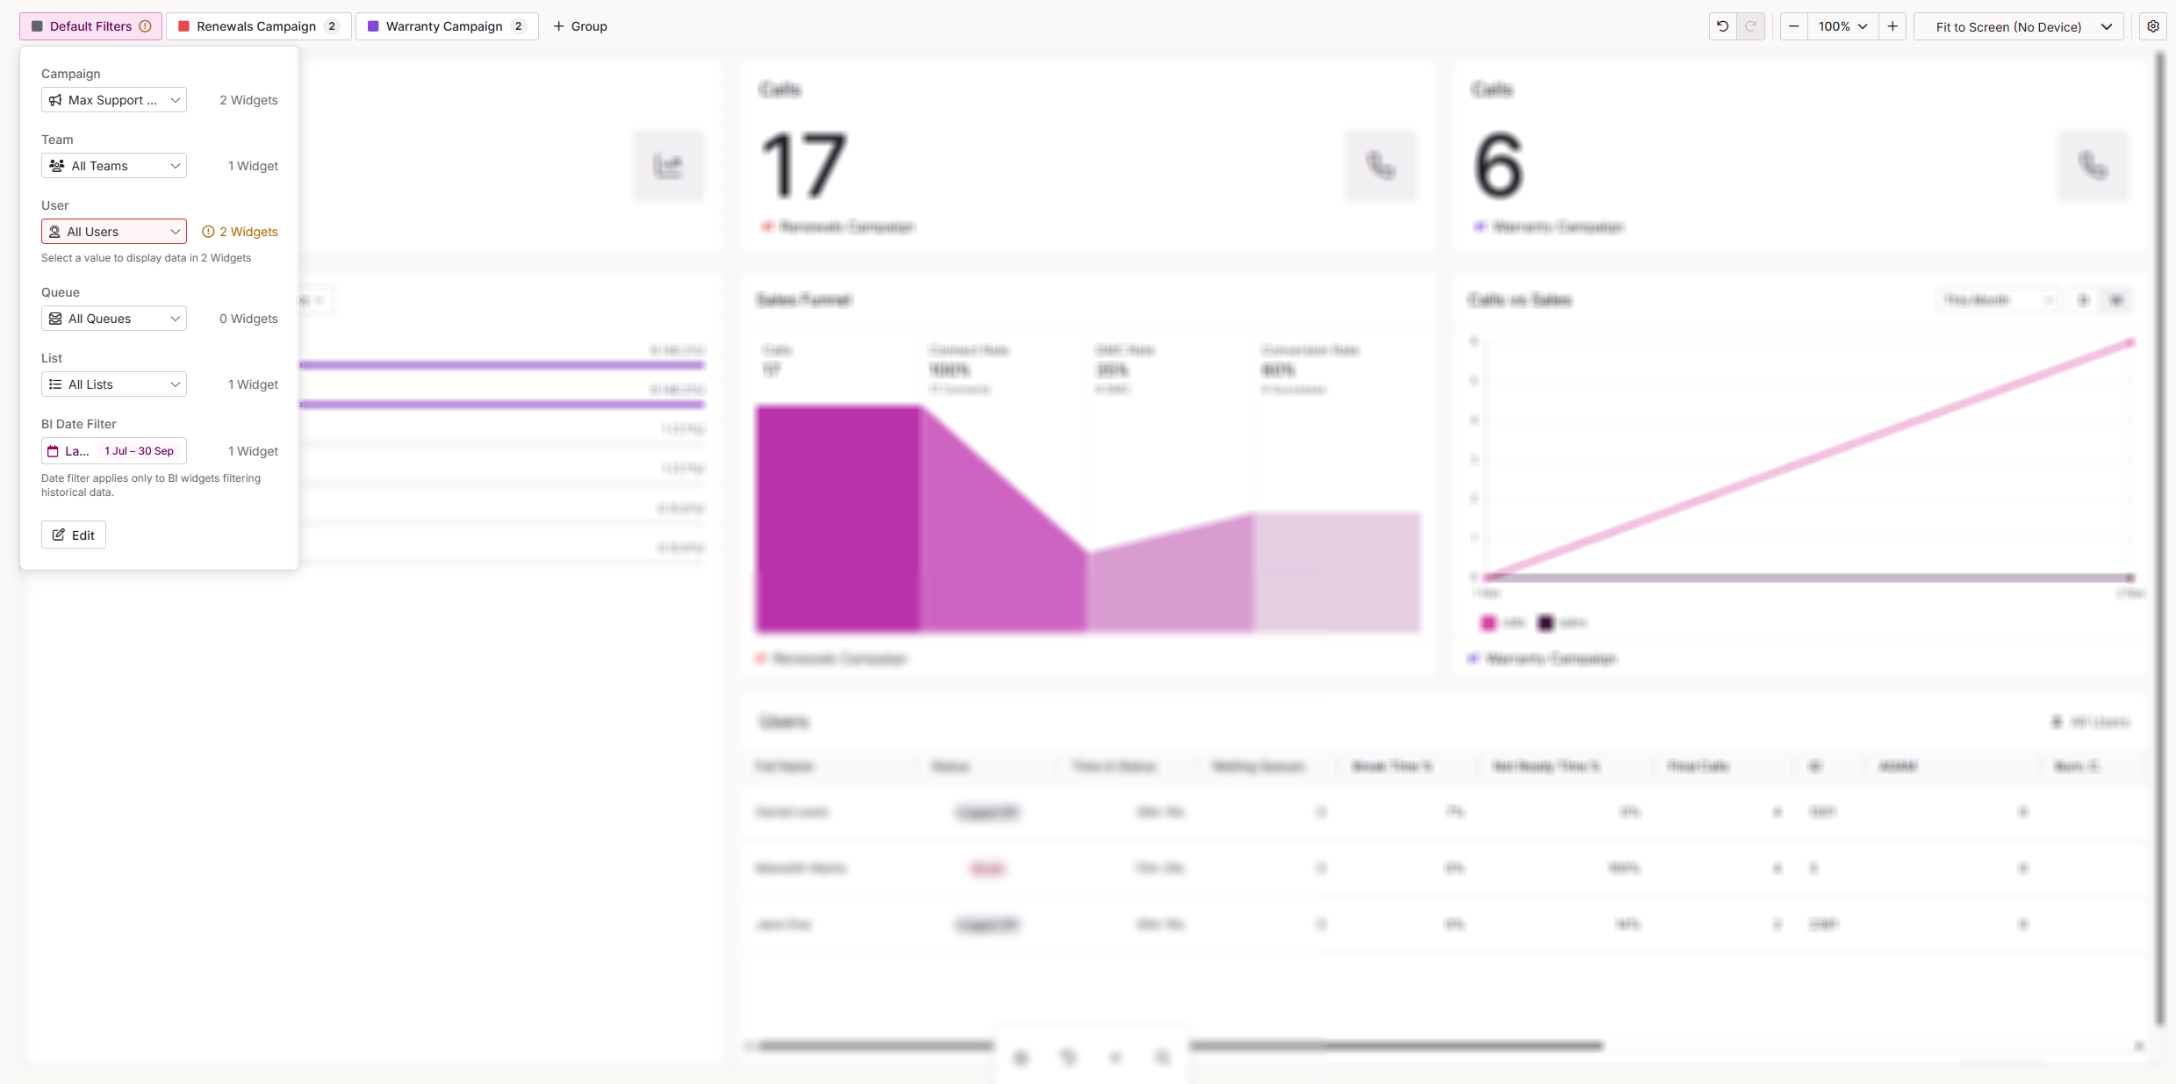
You can filter by the following data types:
| Data type | What it filters |
|---|---|
| Campaigns | Shows data for the campaigns you select. |
| Teams | Shows data for users whose primary team is the team you select. Users are only included under their primary team, not any other teams they are assigned to. |
| Users | Shows data for the users you select. |
| Queues | Shows data for the queues you select. |
| Lists | Shows data for the lists you select. |
| BI Date Filter | Sets the date range for widgets that show BI data. This replaces the Date Filter widget from Dashboard Designer. It applies to the following widgets:
|
You only need to set the data types your widgets use. For example, if your dashboard only contains campaign widgets, you only need to set the Campaigns filter.
Setting your dashboard filters
- Select Default Filters at the top left of the canvas.
- For each data type your widgets use, select the campaign, team, user, queue or list you want to show.
- Close the filter panel. Every widget using the dashboard filters updates to show the new data.
Filter groups
A filter group is a separate set of filters that you can assign to selected widgets. Widgets in a filter group follow that group's filters, while the rest of your dashboard keeps following the main dashboard filters.
For example, you could set your dashboard filters to Campaign A and create a filter group set to Campaign B. Assign two widgets to the filter group and they show Campaign B, while everything else shows Campaign A. Change the campaign in the filter group and only those two widgets update.
Create a filter group
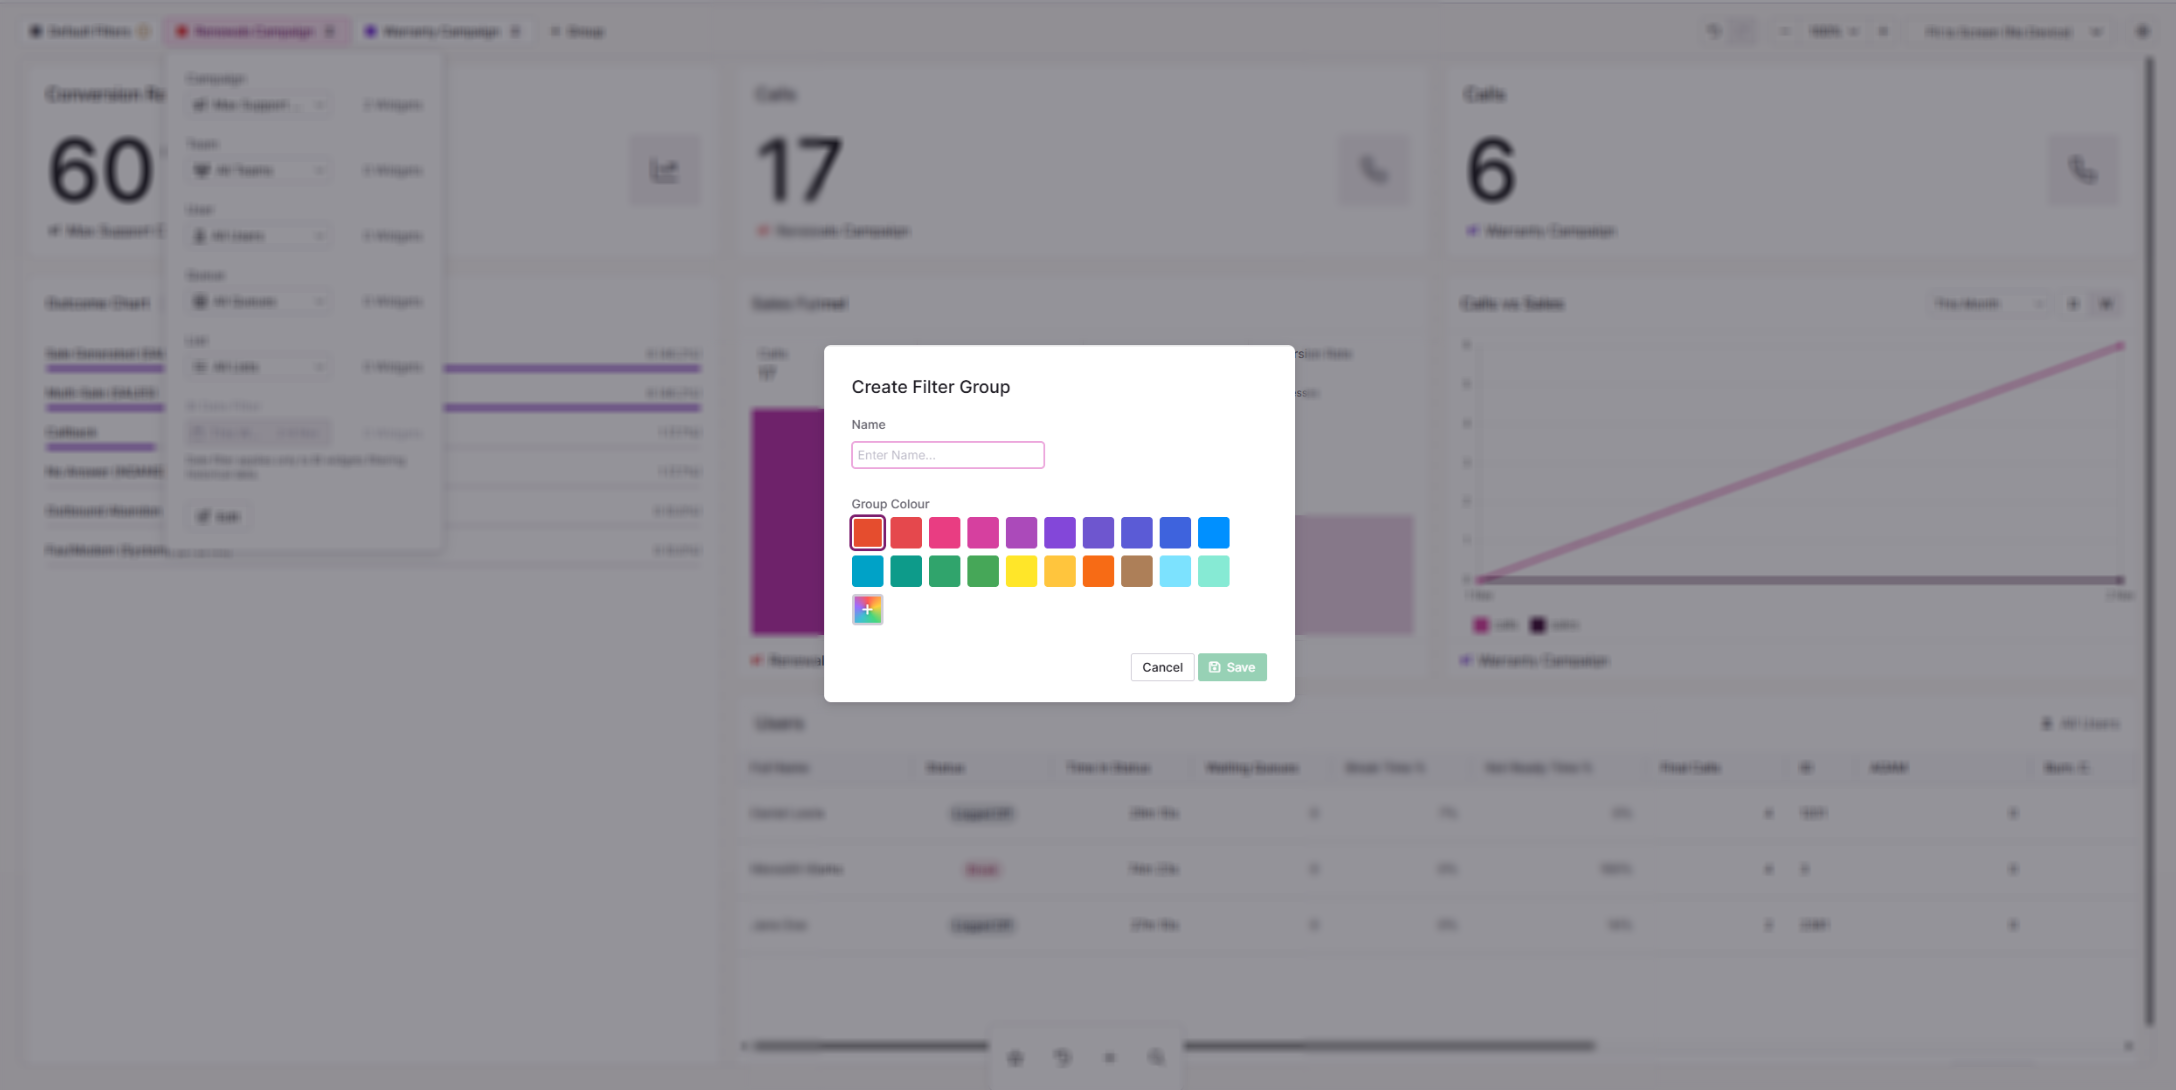
- Select + Group.
- Enter a Name for the filter group.
- Select a colour for the group. The icon on each widget assigned to this group shows in the same colour, so you can see at a glance which widgets it controls.
- Save the filter group.
Assign widgets to a filter group
- Select the widget on the canvas.
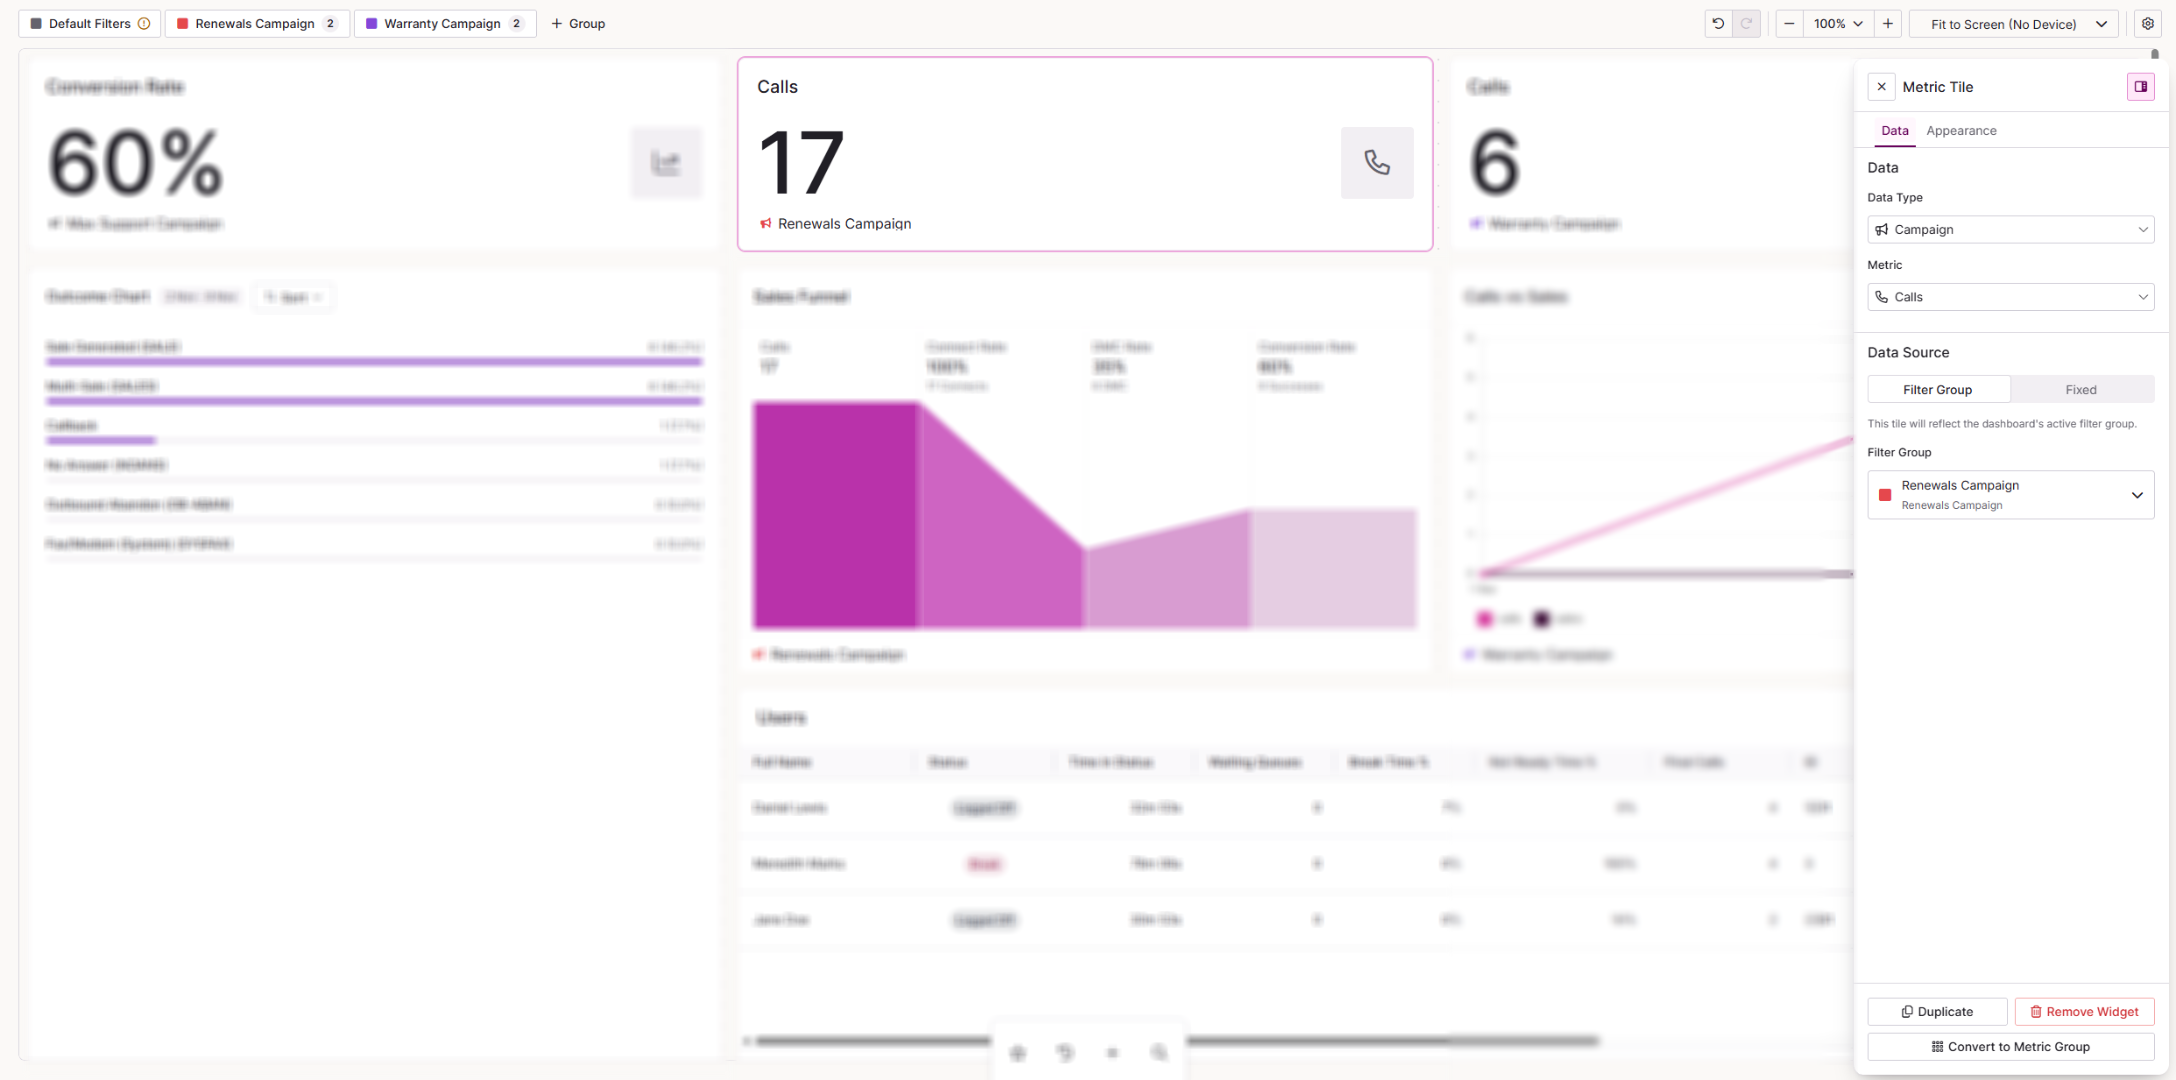
- On the widget's Data tab, go to Data Source and choose the filter group.
- Repeat for any other widgets you want in the group.
Set a filter group's filters
You can set a filter group's filters once it has a widget assigned with a data type set. The data types you can filter by match the data types of the widgets in the group.
For example, place a Metric Tile on the canvas, assign it to a filter group called Filter A and set its Data Type to Campaign. You can then open Filter A and choose the campaign from the dropdown.
Edit a filter group
To change a filter group's name or colour, open the filter group and select Edit at the bottom of the window.
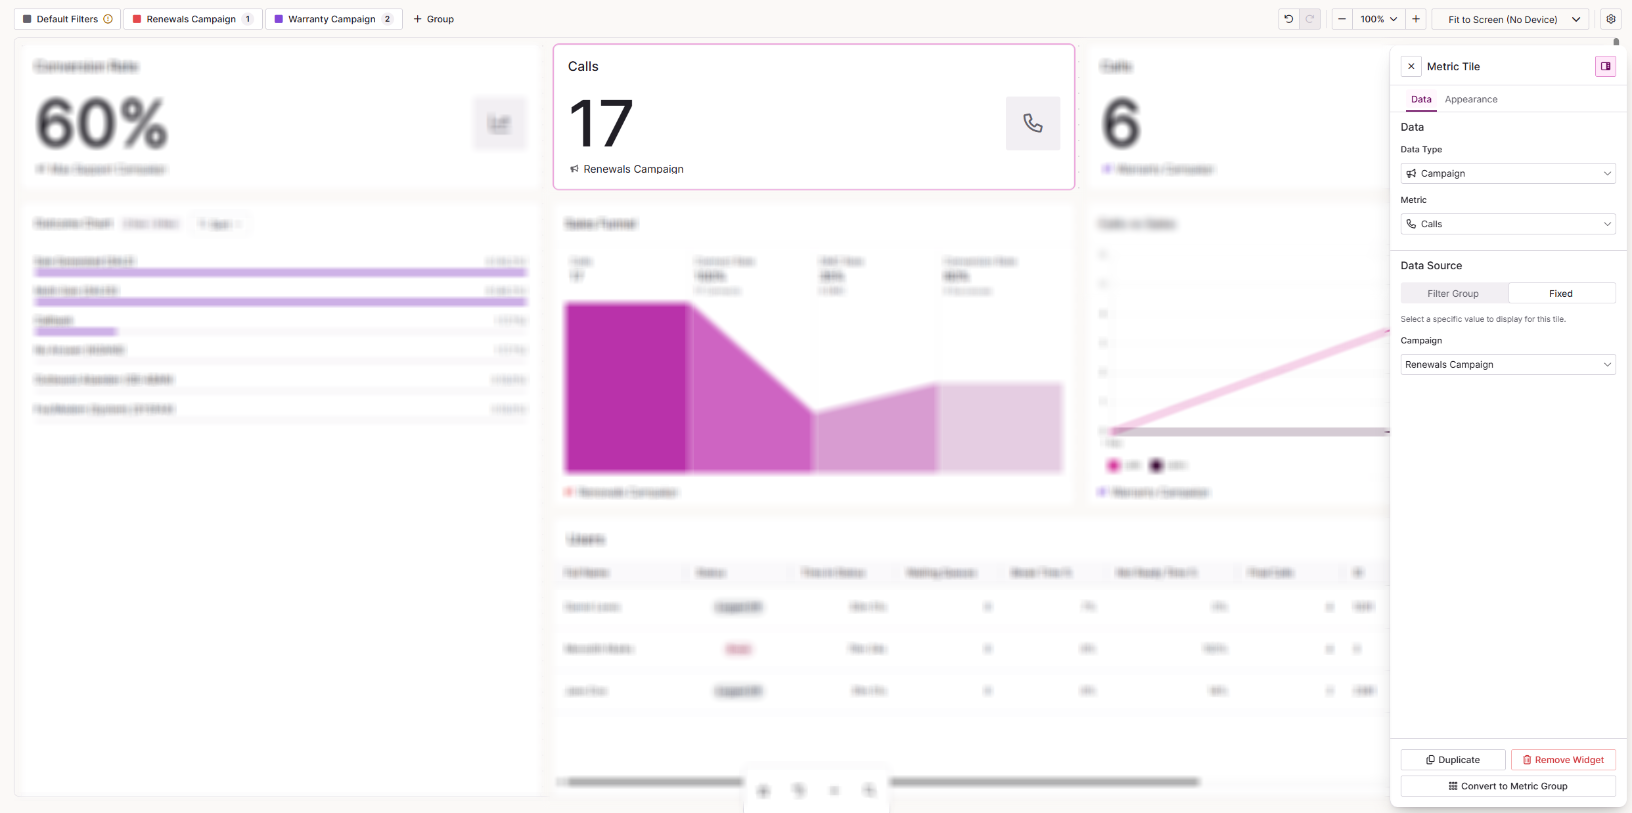
Use a fixed source
If a widget should always show the same data, whatever your filters are set to, give it a fixed source.
- Select the widget on the canvas.
- On the widget's Data tab, set Data Source to Fixed.
- Depending on the widget's data type, select what it should always show, for example a fixed campaign, list or queue.
The widget now ignores the dashboard filters and any filter groups.
If a widget is not showing data
Widgets in Dashboard Studio tell you why they have nothing to show. Check the following:
- There is an ! next to Default Filters or a filter group. The widget needs a data source set in the filter it uses, whether that is the dashboard filters or a filter group. Open that filter and set a value for the data type marked with the !.
- The widget shows No Data Available. Open the widget's Data tab and check its filter group and data type. Change the filter group or the data type to see data.
- The widget is in a filter group. Check the colour of the icon on the widget to see which filter group it uses, then make sure that filter group has the right data types set, not just the main dashboard filters.
- The widget says no data type or metric is selected. Select the widget and complete its Data tab settings.
- The widget always shows the same data. Check whether its Data Source is set to Fixed.