

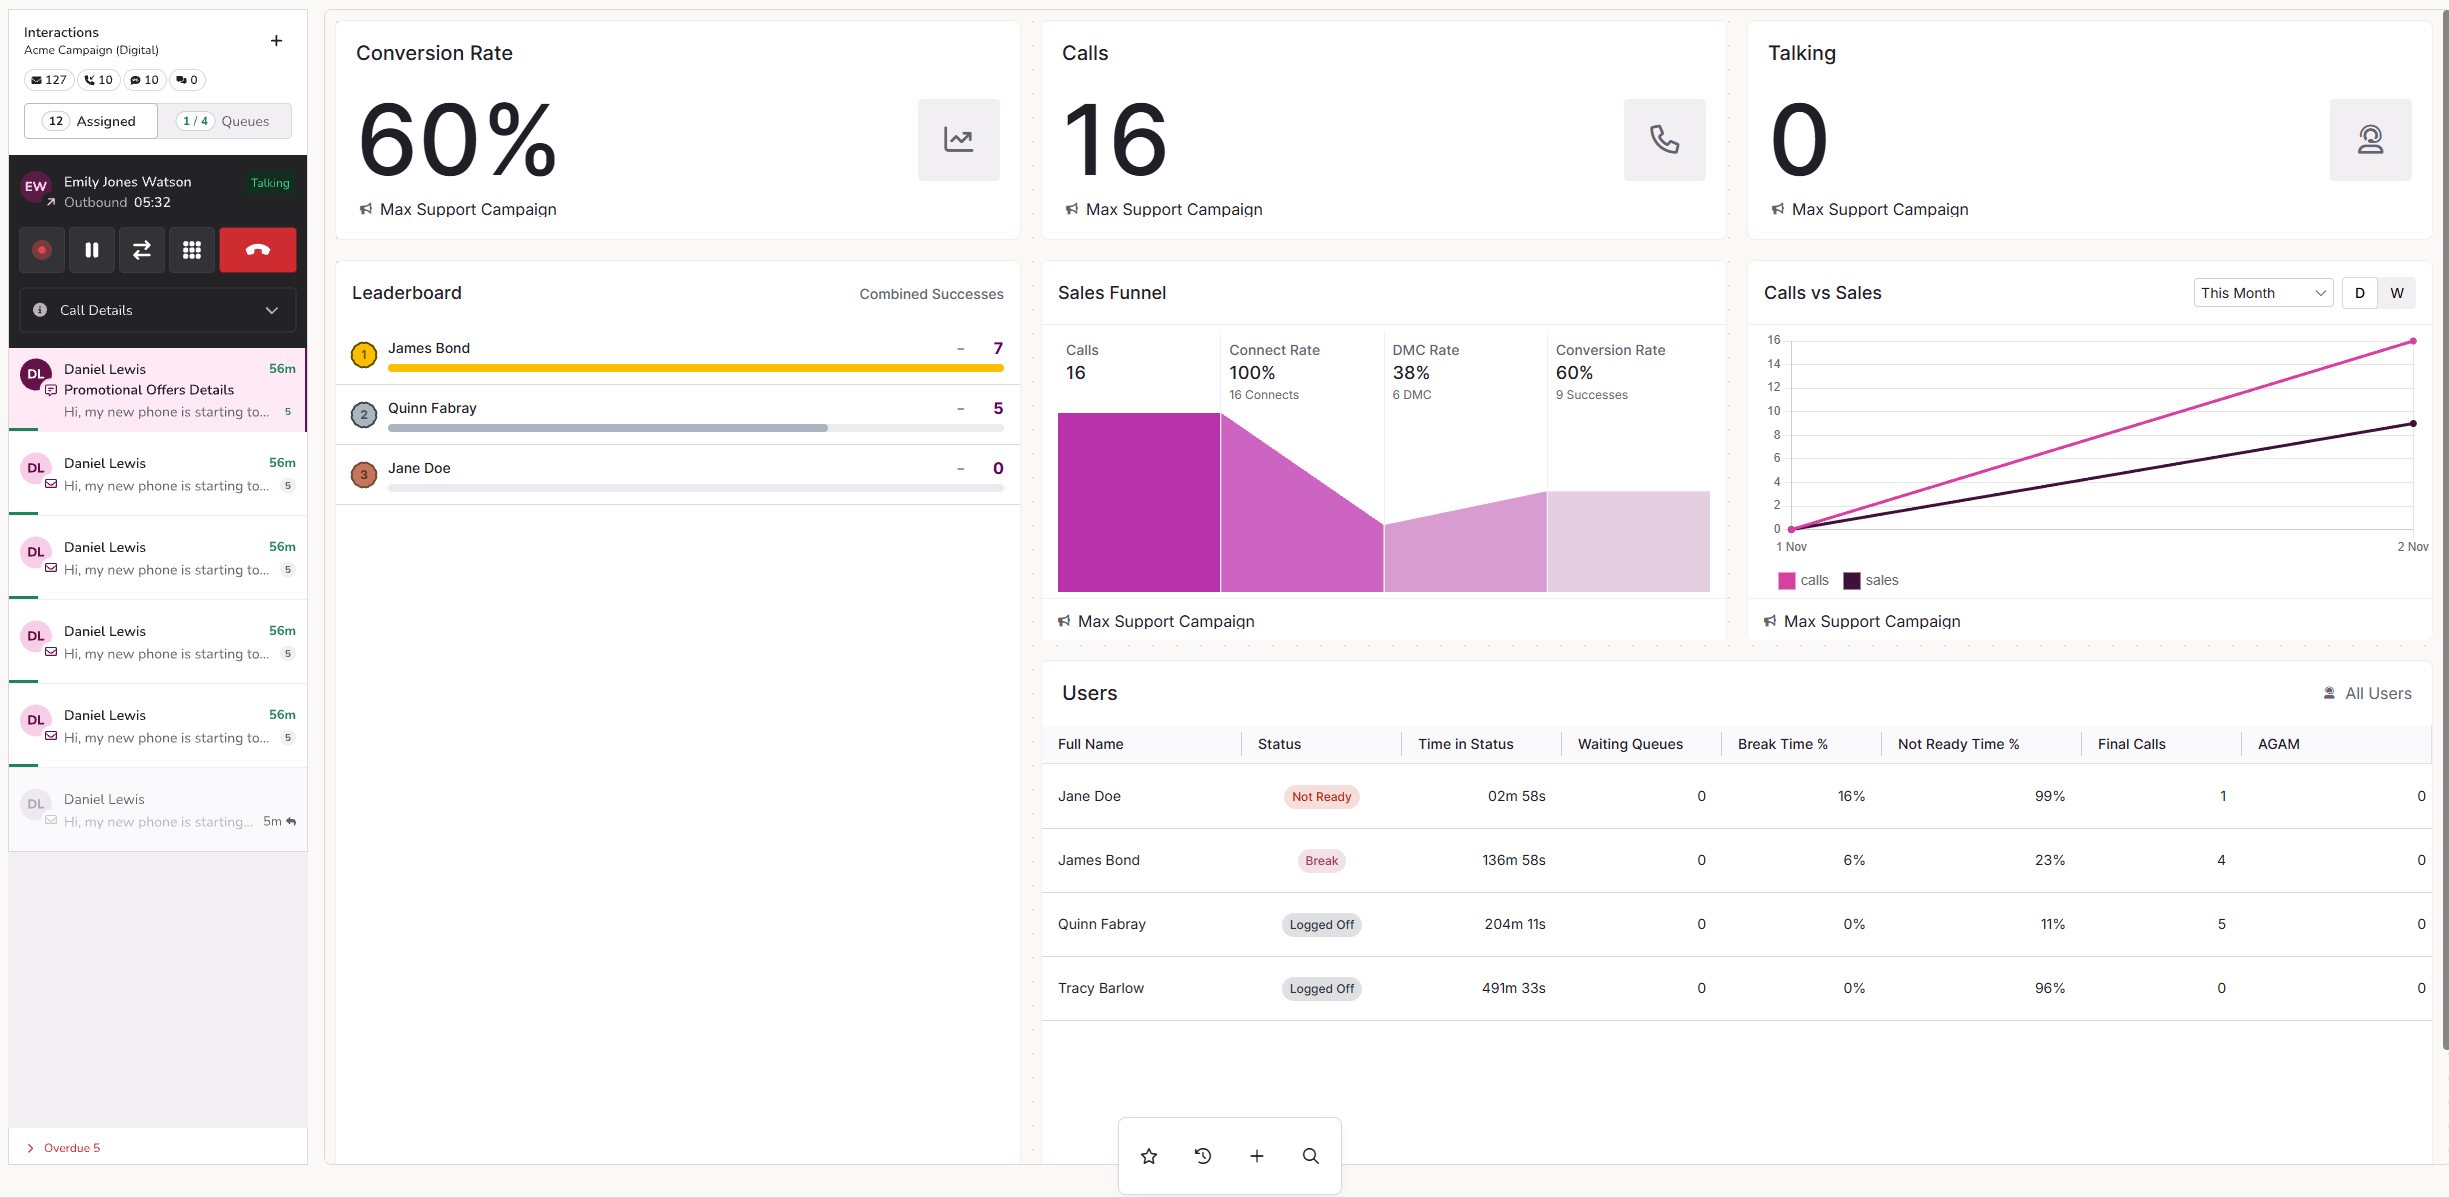
Dashboard Studio
Dashboard Studio is where you build and edit dashboards in MaxContact. You can place widgets anywhere on the canvas, set a look and feel for the whole dashboard in one place, and preview how it will appear on different screens and in Contact Hub before you share it.
Dashboard Studio is for supervisors, team leaders and managers who build dashboards to monitor live performance. You can publish dashboards to Contact Hub for agents and can be shared as a link for display on wallboard screens.
To create a dashboard, go to Dashboards > Create Dashboard. When asked which tool to use, choose Dashboard Studio.
Page layout
Dashboard Studio is laid out around the dashboard you are building:
| Area | What it does |
|---|---|
| Canvas | The main area in the centre of the page, where you build your dashboard. Drag widgets to place them wherever you want, and resize them to fit. |
| Top toolbar | Undo and redo, zoom, and the screen size preview. |
| Filters | Sits above the canvas on the left. Set the filters your widgets use, and create filter groups. |
| Settings pane | Sits on the right. With no widget selected, it shows the settings for the whole dashboard. Select a widget and it updates to show that widget's settings instead. |
| Bottom toolbar | Add widgets to your dashboard, using your favourites, recent widgets, the full widget library or Power Search. |
If a widget is not showing data, it tells you why. For example, it may need a data type or metric selecting, or a filter setting up.
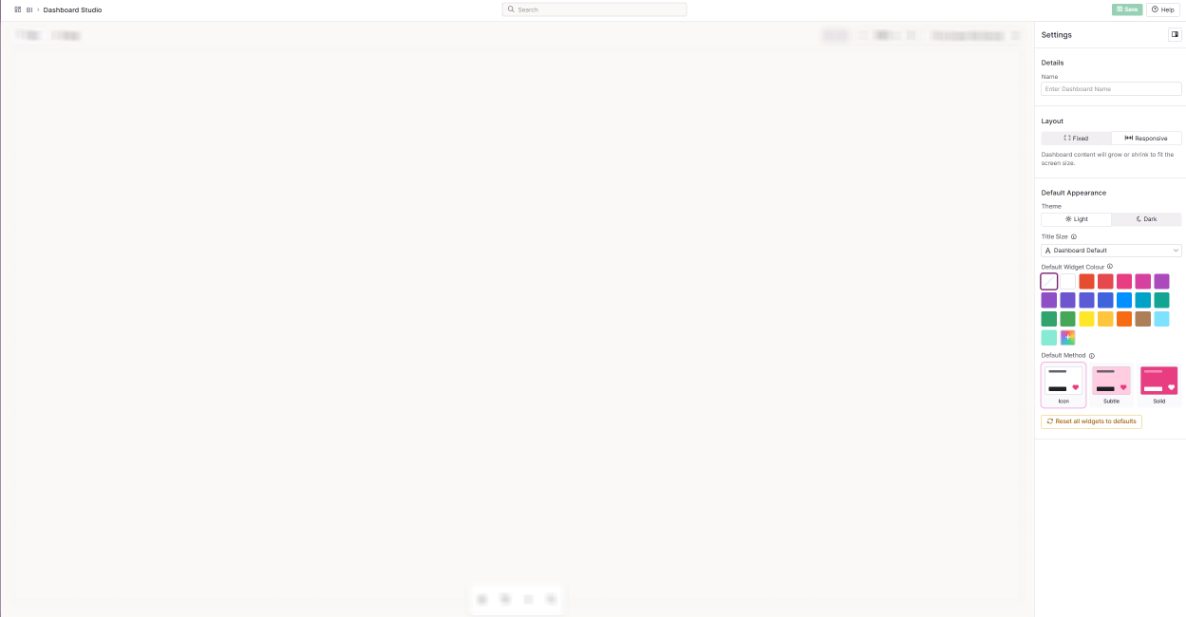
Dashboard settings
Select an empty area of the canvas so no widget is selected. The settings pane then shows the settings for the whole dashboard.
Details
| Setting | Description |
|---|---|
| Dashboard Name | The name of your dashboard. Edit it here at any time. |
Layout
| Setting | Description |
|---|---|
| Fixed | The dashboard keeps the same dimensions on every screen size. Use this for very large or wide dashboards, where viewers are happy to scroll. |
| Responsive | The dashboard content grows or shrinks to fit the width of the screen, so viewers do not need to scroll across. Use this when the same dashboard is viewed on different screens, such as a laptop and a larger monitor. |
Default Appearance
These settings apply to every widget on the dashboard. Individual widgets can override them from their own Appearance tab.
| Setting | Description |
|---|---|
| Theme | Choose a Light or Dark theme for the dashboard. This changes the dashboard only, not the rest of MaxContact. |
| Title Font Size | The default size of widget titles across the dashboard. |
| Default Widget Colour | The default colour for supported widgets. Choose from 22 preset colours, or use the colour picker to enter a hex code or RGB value. |
| Default Method | How the default colour is applied to supported widgets. Choose Icon to colour only the widget icon, Subtle to fill the widget with a lighter shade of the colour, or Solid to fill the widget with the full colour. |
To clear any appearance changes made on individual widgets, select Reset all widgets to defaults at the bottom of the settings pane. Every widget then uses the dashboard's Default Appearance settings.
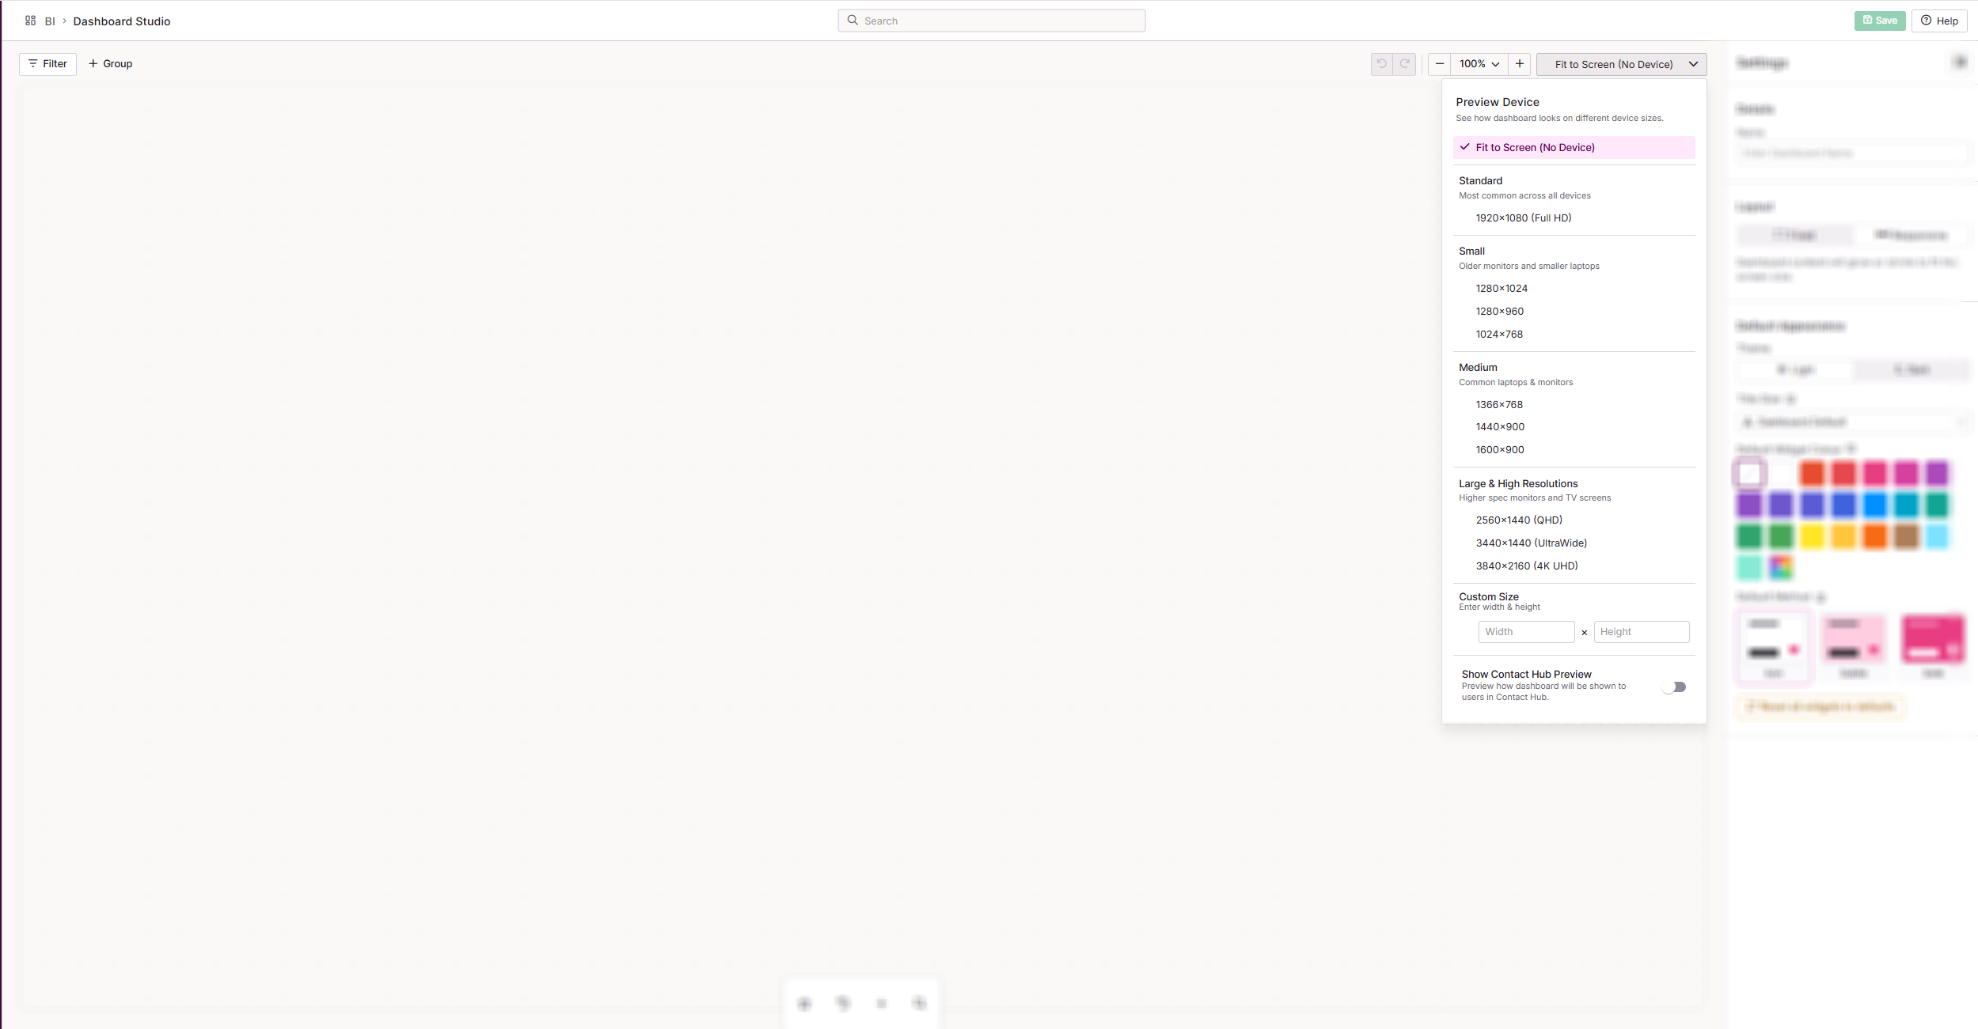
Top toolbar
| Setting | Description |
|---|---|
| Undo and Redo | Undo or redo changes you have made since you last saved. Once you save, you cannot undo those changes. |
| Zoom | Zoom in or out of the canvas while you build. |
| Preview Device | Preview how your dashboard looks at different screen resolutions. Choose from Standard, Small, Medium, and Large & High Resolution presets (for example, 1920x1080 Full HD), or set a custom size to match a specific screen. |
| Show Contact Hub Preview | Found in the Preview Device dropdown. Shows how your dashboard will look to agents in Contact Hub. |
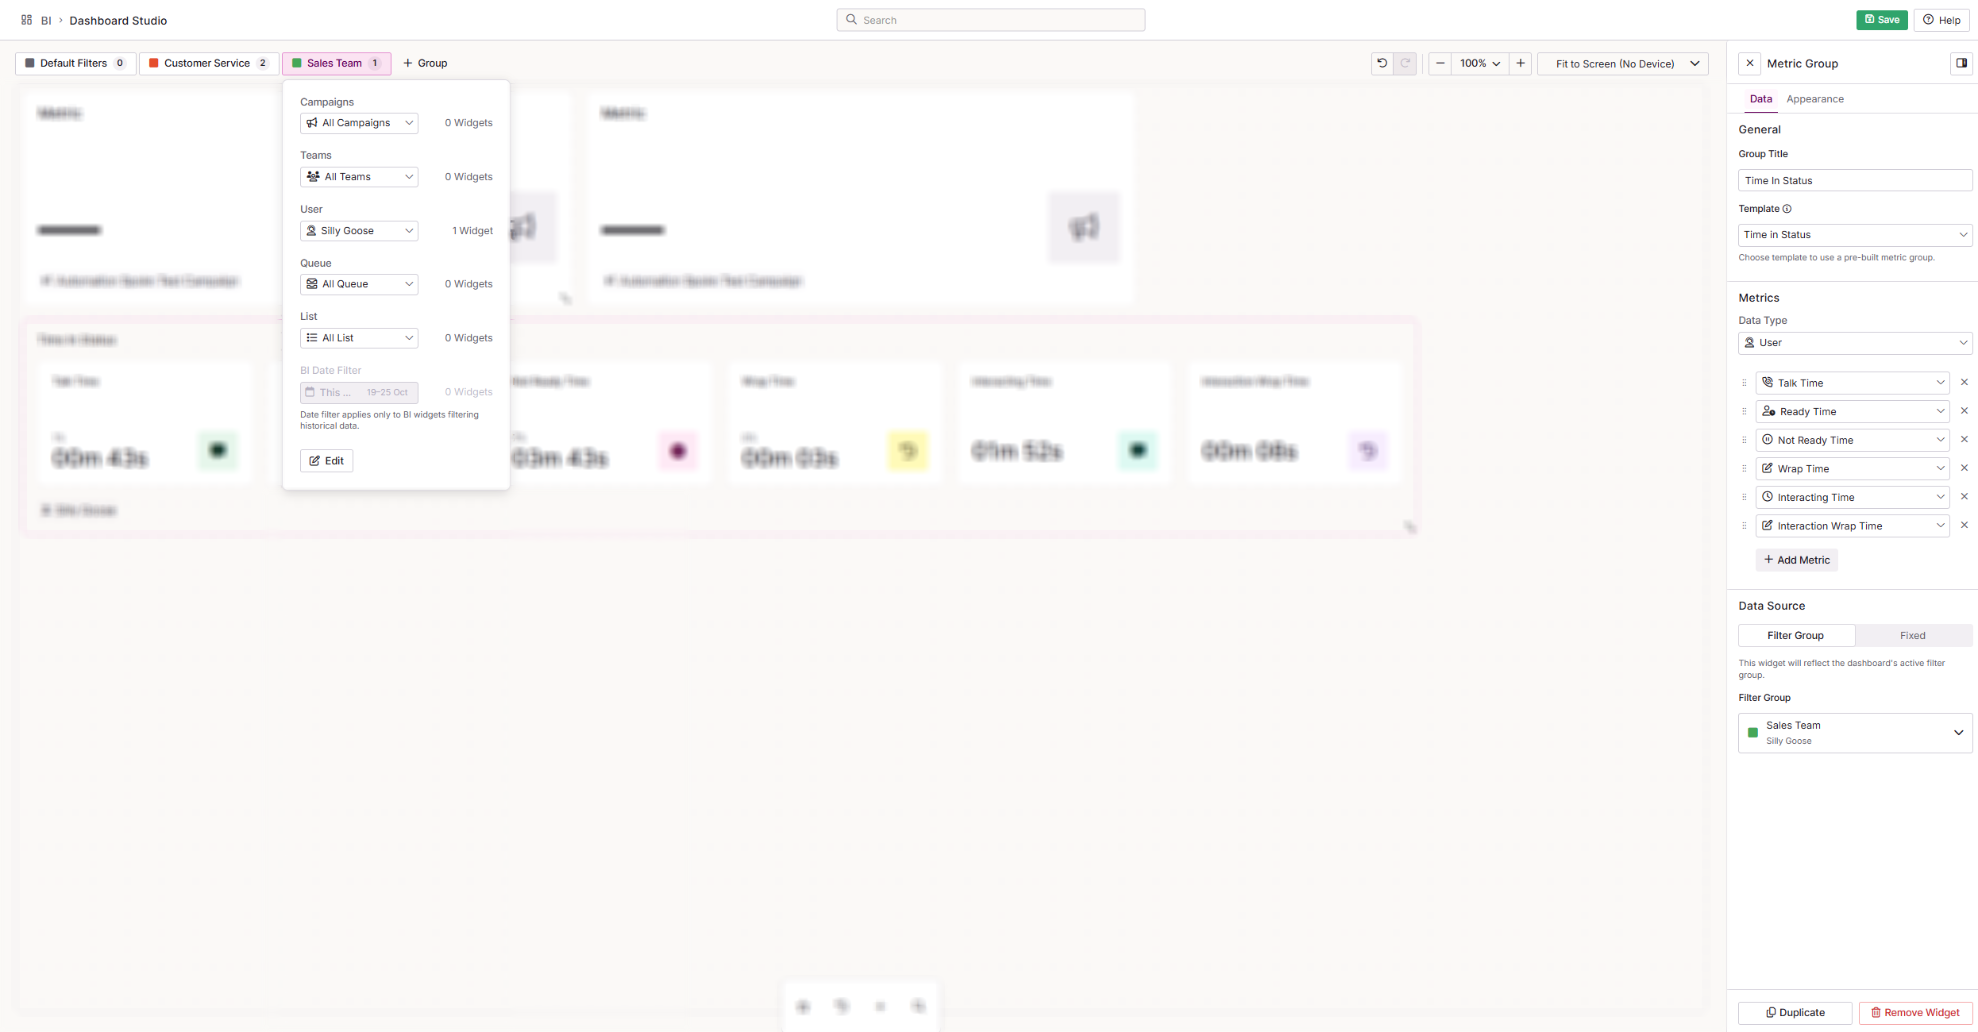
Filters and filter groups
Filters control which data your widgets show, such as a specific campaign or team. They work in a similar way to Dashboard Designer, with clearer prompts when something is not set up correctly.
The available filter data types are Campaigns, Teams, Users, Queues, Lists and BI Date Filter. The BI Date Filter replaces the Date Filter widget from Dashboard Designer.
Filter groups
By default, every widget uses the dashboard's main filters. Filter groups let you apply a different set of filters to selected widgets. For example, most of your widgets could show one campaign while a few show another.
To create a filter group:
- Select + Group.
- Enter a Name for the filter group.
- Select a colour. Widgets using this filter group are marked with the same colour on the canvas.
- Assign at least one widget to the filter group. The filter dropdowns stay locked until you do.
- Set the filters for the group.
To change a filter group's name or colour, select Edit at the bottom of the filter group window.
To stop a widget using any filters, set its Source to Fixed in the widget's settings. The widget then always shows the data you choose, whatever the dashboard filters are set to.
Adding widgets
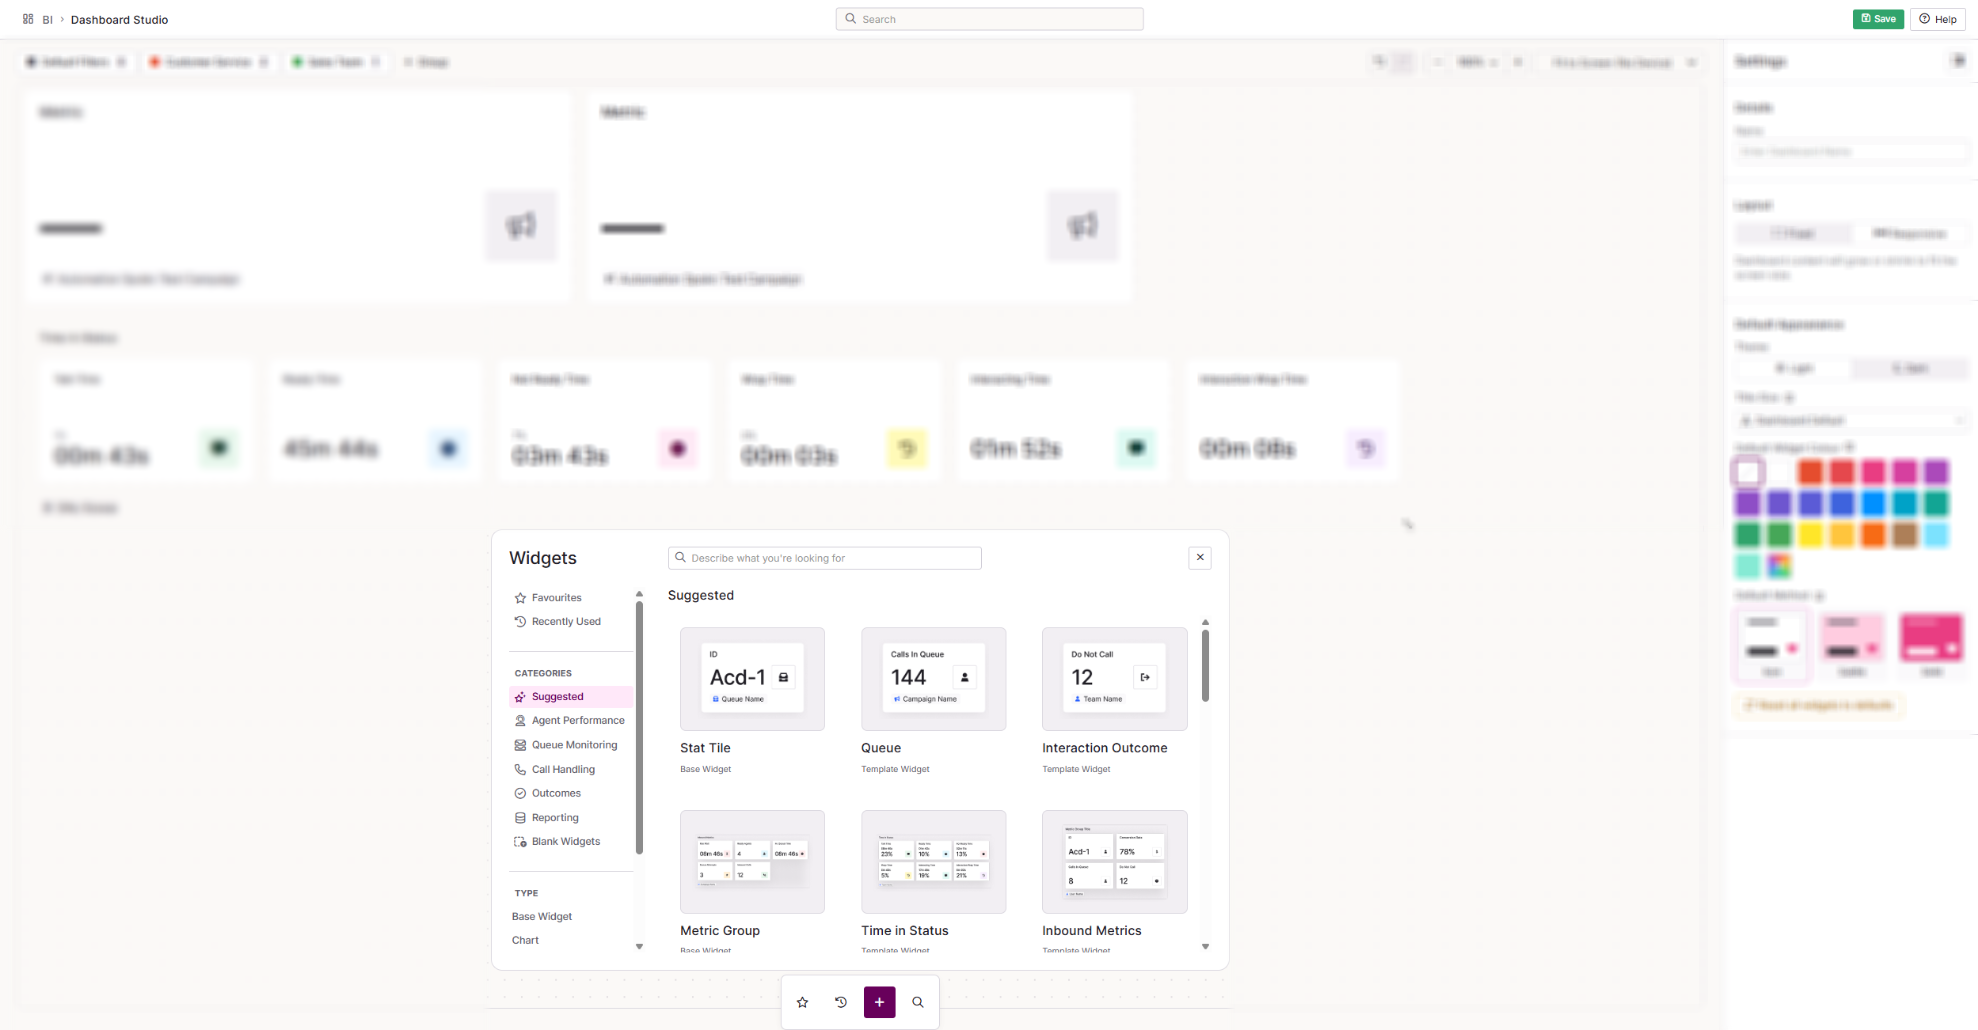
Use the toolbar at the bottom of the page to add widgets to your dashboard.
| Option | What it does |
|---|---|
| Favourites | The widgets you have marked as favourites, for quick access. |
| Recents | The widgets you have used recently. |
| Add Widget | Opens the full widget library. |
| Power Search | Search the widget library to find a widget quickly. |
The widget library
The widget library lists every widget available in Dashboard Studio. From here you can:
- Search for a widget by describing what you are looking for.
- Hover over a widget to see more information about it.
- Select the star icon on a widget to add it to your favourites.
- Select + Add to place a widget on the canvas.
- Browse by Favourites, Recently Used, Categories (grouped by the information the widget shows) or Type (such as grids, charts or leaderboards), using the menu on the left.
Once a widget is on the canvas, select it to open its settings in the settings pane.
Sharing your dashboard
You manage access to your dashboards, including publishing to Contact Hub and sharing by link, from Dashboard Management. There is no separate wallboard page. To show a dashboard on a wallboard screen, share it as a link.