

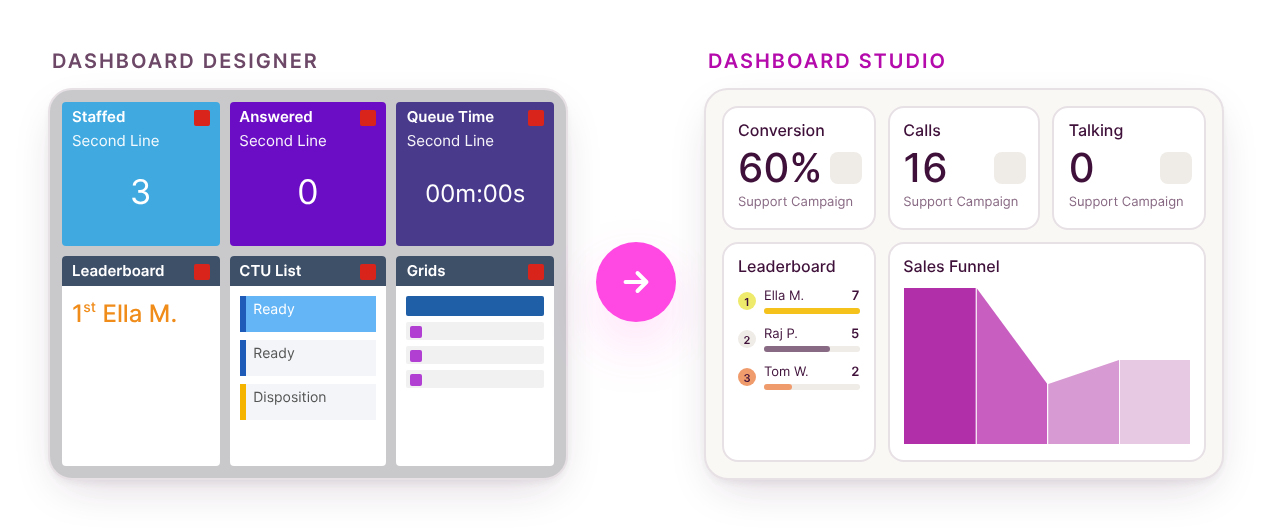
Moving from Dashboard Designer to Dashboard Studio
Dashboard Studio replaces Dashboard Designer as the way you build dashboards in MaxContact. It uses the same live data you already rely on, with an easier way to build, style and filter your dashboards.
Dashboards built in Dashboard Designer do not move across to Dashboard Studio automatically. To keep using a dashboard once Dashboard Designer is retired, you rebuild it in Dashboard Studio. This article explains what stays the same, how to prepare, and which widgets have changed.
Accessing Dashboard Studio
While both tools are available, you choose which one to use each time you create a dashboard.
- Go to Dashboard Management.
- Select Create Dashboard.
- Select Try Dashboard Studio to build your dashboard in Dashboard Studio.
To build in Dashboard Designer instead, select Not Now at step 3.
What stays the same
- Your data. Dashboard Studio uses the same metrics and stats as Dashboard Designer.
- Access and permissions. You still manage who can see a dashboard, publish to Contact Hub and share by link from Dashboard Management.
- How agents see dashboards. Agents still view published dashboards in Contact Hub.
- Filters and filter groups. These work in the same way, with clearer prompts when something needs setting up.
- Most widgets. Nearly every Dashboard Designer widget is available in Dashboard Studio, although some have new names.
Before you start
A little preparation makes rebuilding quicker:
- Review your dashboards. List the Designer dashboards your teams use, and leave out any you no longer need.
- Start with Contact Hub dashboards. Dashboards published to agents in Contact Hub also need rebuilding, so prioritise these.
- Note your filters. Record the filters and filter groups each dashboard uses, so you can set them up the same way.
- Check for removed widgets. If a dashboard uses a widget listed under Removed widgets, decide what to use instead before you start.
Rebuilding a dashboard
- Create a new dashboard in Dashboard Studio. See Accessing Dashboard Studio above.
- In the settings pane, set the dashboard Layout and Default Appearance.
- Add your widgets from the widget library. Use the Widget name changes table to find the Studio version of each Designer widget.
- Set your dashboard filters and any filter groups.
- Use Preview Device to check the dashboard at the screen size it will be shown on, and Show Contact Hub Preview to check how agents will see it.
- Save the dashboard, then publish and share it from Dashboard Management.
- Update any wall screens or bookmarks that show the old Designer dashboard so they use the new dashboard's link.
For details on each step, see Dashboard Studio: Overview and Dashboard Studio: Filters and Filter Groups.
Widget name changes
Some widgets have new names in Dashboard Studio. Any widget not listed here keeps the same name.
| Dashboard Designer | Dashboard Studio |
|---|---|
| Bar Chart | Chart |
| Picture | Image |
| Result Code List | Outcome List |
| Result Code Chart | Outcome Chart |
| Queues Tile | Queue |
| Result Code Tile | Interaction Outcome |
| Break Table | Breaks |
| Result Code Activity | Outcome Activity |
| Queue Grid | Queues |
| Inbound Block | Inbound Metrics |
Dashboard Studio also includes a new widget, Metric Group, which shows several metric tiles together with a shared data source and filter.
Removed widgets
The following widgets are not available in Dashboard Studio.
| Widget | What to use instead |
|---|---|
| System Activity | View live call activity on the System Activity page. |
| Campaign Manager | Manage your campaigns on the Campaign Manager page. To show campaign stats on a dashboard, use a Configurable Grid with the Campaign data type. |
| User Data | View user data in CTU and in Scripting fields. |
| Target Comparison | No replacement. The Targets page has also been removed. |
| Date Filter | Set the date using the BI Date Filter in the dashboard filters. |
Other changes to be aware of
| Change | What it means for you |
|---|---|
| Chart types | Charts offer Column and Line types. Area and stacked bar charts are no longer available. |
| Result code pie chart | Replaced by the Outcome Chart, a horizontal bar chart that is easier to read from a distance. |
| Configurable Grid actions | Actions are no longer a column. Hover over a row to see the actions your permissions allow. |
| Configurable Grid stats | Number of Working Days, Success Per Working Day and Successes Per Working Day have been removed, along with Wrap Time % for lists. See Dashboard Studio: Configurable Grid Stats by Data Type. |
| Wallboards | There is no separate wallboard to build. To show a dashboard on a wall screen, share it as a link from Dashboard Management. |